By Pasi Autio 20th of October 2020 / Updated 2nd of September 2021
Back in October 2020 a new United Nations report claimed doubling of natural disasters between periods 1980-1999 and 2000-2019:
“Human cost of disasters
An overview of the last 20 years 2000 to 2019
GENEVA, 12 October 2020 – A UN report published to mark the International Day for Disaster Risk Reduction on October 13, confirms how extreme weather events have come to dominate the disaster landscape in the 21st century.
In the period 2000 to 2019, there were 7,348 major recorded disaster events claiming 1.23 million lives, affecting 4.2 billion people (many on more than one occasion) resulting in approximately US$2.97 trillion in global economic losses.
This is a sharp increase over the previous twenty years. Between 1980 and 1999, 4,212 disasters were linked to natural hazards worldwide claiming approximately 1.19 million lives and affecting 3.25 billion people resulting in approximately US$1.63 trillion in economic losses.
Much of the difference is explained by a rise in climate-related disasters including extreme weather events: from 3,656 climate-related events (1980-1999) to 6,681 climate-related disasters in the period 2000-2019.
The last twenty years has seen the number of major floods more than double, from 1,389 to 3,254, while the incidence of storms grew from 1,457 to 2,034. Floods and storms were the most prevalent events.”
Doubling of natural disaster events – this is bad. The conclusion was based on EM-DAT International Disaster Database (1) consisting of 22000 mass disasters in the world between 1900 and 2020.
Now in September 2021 WMO makes even more alarming claim: Five-fold increase of natural disasters during last 50 years.
These claims are so bold that this requires more thorough analysis of the original data. Everyone can access the EM-DAT database by registering as EM-DAT user. Access is free for non-profit organizations, so let’s do it.
After approval as an EM-DAT database user, I was able to download the whole database of disasters between 1900 and 2020. By just selecting natural disasters I got the Excel file of 15564 individual disasters, each as a line in the Excel. Data contains up to 43 different columns of information for each disaster – for most disasters only less than half of the columns has any data.
Database includes disasters with following categories:
- Climatological – Droghts, wildfires
- Hydrological – Floods, Landslides
- Meteorological – Storms, extreme temperatures
- Geophysical – Volcanic activity, earthquakes
- Biological – Epidemics, insect infestation
- Technological – Industrial accidents, transport accidents
- Extra-terrestial – Meteor impacts
First three categories can be weather-related and are the key in UN and WHO claims.
Let’s start by plotting a diagram of number of weather-related disasters each year between 1900 and 2020.
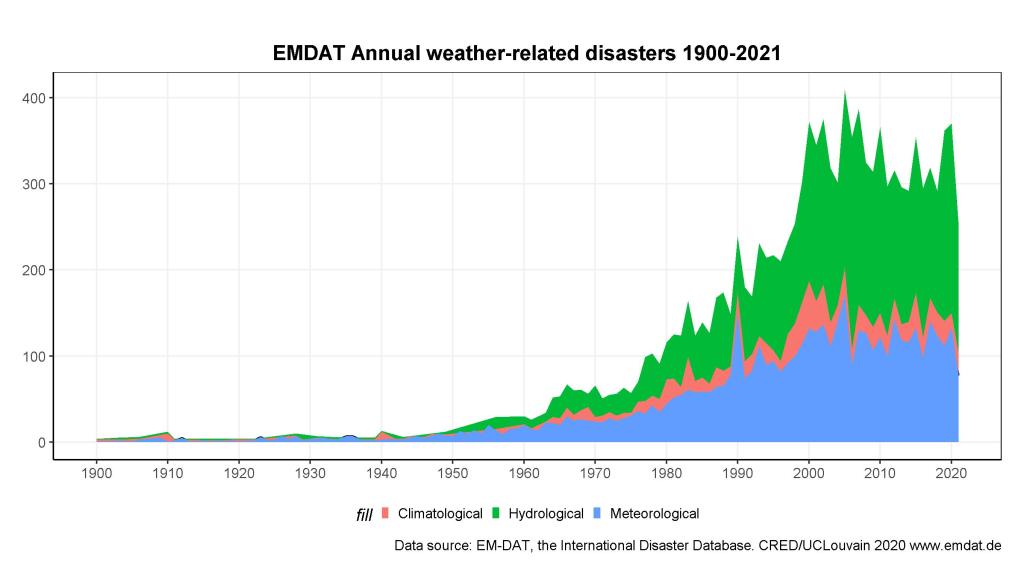
Figure: All weathe-related disasters worldwide in EM-DAT database
It’s easy to see where the UN claim comes from. Indeed the weather-related disasters have increased considerably during years 2000-2019 compared to years 1980-1999. But at the same time we see the first hint of what is wrong: There is a gradual increase of disasters from 1940s level to today’s level. If you see this kind of data the first question you have is the reporting: How does the improved reporting and data collection affect the dataset?
Let’s plot the number of countries reporting at least one natural disaster per year between 1900-2020:

Figure: Countries reporting at least one natural disaster each year
From the list of countries reporting at least one disaster we can see huge increase of reporting countries during the years. Also the shape of the data is very similar to the total number of natural disasters plotted earlier. Note: This figure includes countries reporting for all disaster types in the database – not only for natural disasters. If we limit ourselves just to natural disasters, the shape is exactly the same.
During 1901, for example, there was only two countries in the database (Japan and Uganda) whereas during 2000-2019 the number of countries reporting was about 120-150 each year. Even the new data has a lot less than countries than there is countries in the world, so it is likely that even the years 2000-2019 are underreporting the actual natural disasters quite heavily while considering that there are number of small countries in the world, which are unlikely to ever face any significant natural disaster (example: Vatican).
In the UN paper the years 1980-2019 are of specific interest. You can see significant increase of reporting countries between 1980 and 2000. After that the number is quite steady. You might think this is due changes like Soviet Union breaking to many different countries, so let’s analyze Soviet Union in more depth:

Figure: Natural disasters in Soviet Union for each year between 1900-1991
We can see that the Soviet Union was not the most open reporter of natural disasters to the EM-DAT database and the increase of countries reporting natural disaster during 1990s is not the result of Soviet Union breakup. And what is the likelihood of country with the size of Soviet Union having only 0-4 weather-related disasters per year? You can easily conclude that this database contains only small portion of real weather-related disasters what happened in Soviet Union. Just the forest fires should have tens of reported incidents every year.
And by the way, it seems that the same “issue” of not reporting disasters seems to affect all former Eastern Bloc countries; almost all of them has a huge increase of natural disasters in the database after breakup of Soviet Bloc at 1991. Yugoslavia, for example, reported 0-2 natural disasters per year, but the just Serbia alone is reporting more than that. Clearly the entry criteria is not comparable between pre- and post-Yugoslavia era.
What about China? China was specifically mentioned in the UN report as a country with significant increase of natural disasters:

Figure: Weather-related disasters in China for each year between 1900-2020
You can see that for years before 1980 there is no meaningful data in the EM-DAT database. The reporting increases gradually after 1980 and reaching “steady state” around year 2000.
For 1980 the database contains just 5 disasters in China: Four floods and one tropical cyclone (there where several cyclones making onshore at China during 1980). The peak year 2013 contains over 30 disasters: Droughts, Extreme temperatures, Storms, Floods. The effect of better reporting year-by-year can be easily seen. Communist China was not the most open reporter of natural incidents either.
How about USA? Modern western civilization must have really good disaster reporting already in 1980s, right?

Figure: Weather-related disasters in USA for each year between 1900-2020
For 1980 the database contains just 8 natural disasters in USA: 4 floods, 3 storms, one volcanic activity (St. Helens) and one heat wave.
No tornadoes are present in the database for 1980, but a little study from Wikipedia tells us that year 1980 was below average tornado year with 28 tornado deaths and several bad outbreaks such as 1980 Kalamazoo tornado outbreak and 1980 Grand Island tornado outbreak. In total the season had 866 reported tornadoes. So, the EM-DAT database is just missing all these events.
Speaking of tornadoes, let’s see how much tornado data is available in the EM-DAT database:
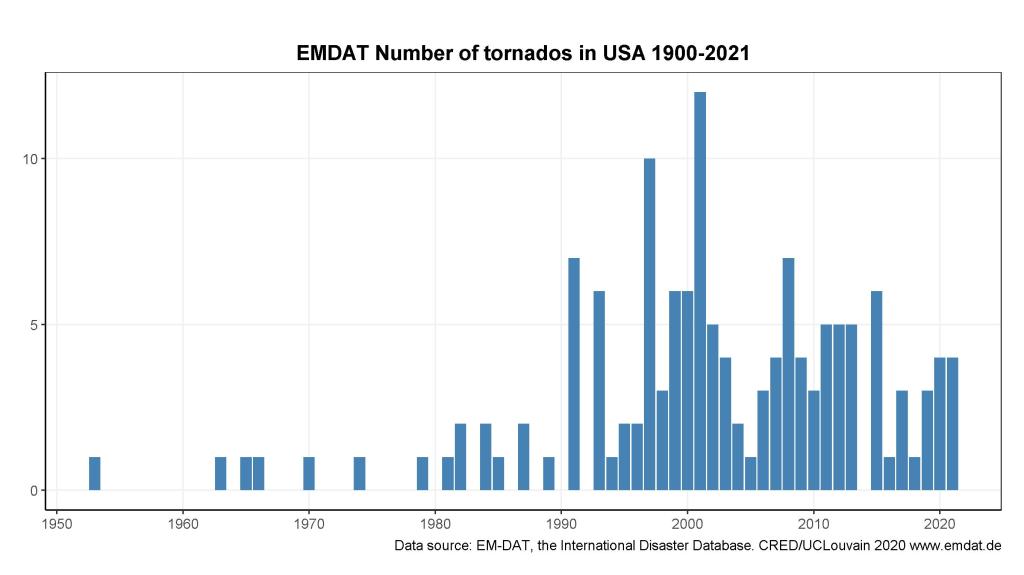
Figure: Number of tornadoes in USA for each year between 1900-2021
It seems that while tornadoes have been the issue in the USA all the time, only after end of 1980s there has been some level of data collection of tornadoes to the EM-DAT database. We also have tornado data available from NOAA. The following graph includes only the most violent tornadoes (class F3+):

While count of tornadoes might not have anything to do with the disasters caused by tornadoes since many tornadoes happen on unpopulated area causing limited or no damage, they should at least on some level match when comparing trends. It’s easy to see that the tornado trend in these datasets goes to opposite direction. EMDAT tornado data has simply nothing to do with reality.
Also no wildfires are present in 1980 data for USA. More in-depth study would reveal some more wildfires, but at least Panorama Fire (1980) is missing from the database. In this fire 28,800 acres burned, destroying 310 homes and 67 structures, killing four people, and injuring 77 in north San Bernardino. Clearly an incident, which should be in database according to the entry criteria.
In USA it seems that only from 1990s forward the database has some level of credibility. Earlier data is simply too lacking to draw any meaningful conclusions about the increase or decrease of natural disasters. But even for recent data, you should not make any conclusions about the number of natural disasters in USA.
The same issue of underreporting on early years seems to affect almost every country I look into. The country I live in, Finland, has only three natural disasters in total in the database; two storms (1990) and one flood (2005). Living in Finland I can assure all readers that we have floods every year (especially with rivers in north we have flooding after every winter) causing material damage almost every year. We also have storms affecting tens of thousands every year usually causing material damage in the forests and lot of damages to the electricity distribution.
What is exactly the entry criteria for EM-DAT database:
Entry criteria: The reason for recording the disaster event into EM-DAT. At least one of the following criteria must be fulfilled in order for an event to be entered into the database:
- Deaths: 10 or more people deaths
- Affected: 100 or more people affected/injured/homeless.
- Declaration/international appeal: Declaration by the country of a state of emergency and/or an appeal for international assistance
As you can see the entry criteria quite relaxed: With this criteria almost every F3 or higher tornado, for example, should be in database assuming it happened on populated area.
Thus, we can conclude that the database really does not have any credibility even today, but even less during 1980s and 1990s. I don’t know how the data collection has been organized, but for scientific analysis of natural disaster trends the EM-DAT database has no scientific value. Therefore also the conclusions in the UN report have not merit. All claims that UN made about the increase of natural disasters should be retracted.
Total damages
UN also reported the sizable increase of damages. Pielke Jr has a lot more scientific merits to say anything about the normalized damages (2) during the years, but we can still make some interesting observations about the EM-DAT data for damages:
It seems that only small part of the entries has any damage data in the database. In 1994, for example, a tropical storm hit Osaka in Japan. According to the database 1000 died and 6.5 million was affected. The cost of this event is missing. This is just one of the thousands of missing damage entries. Only about 1/3 of all entries in the database has any kind of damage estimate. How do you draw any conclusions from that?
Affected people
UN claims that during 1980-1999 natural disasters affected 3.25 billion people whereas during 2000-2019 4.2 billion people was affected. But they omit to discuss the population increases. The world population was:
- 1980: 4.46 billion
- 2000: 6.14 billion
- 2019: 7.71 billion
We can make the rough estimation that during 1980-1999 the average population was 5.4 billion and during 2000-2019 the average population was 6.9 billion. More population should mean more people affected (and dead) due to natural disasters. 3.25 x (6.9/5.4) = 4.15 billion – thus the increase of people affected can be explained entirely with the world population increase. Actually even more, since most of the population increases tend to happen on natural disaster-prone areas such as India, Bangladesh and Africa.
But regarding EM-DAT dataset itself, almost 30% of the whole dataset is missing the affected people data. Older the data is, more of it is missing.
All disaster types
Earlier we concentrated to weather-related disasters. But EMDAT includes also biological, technological and geophysical disasters – all of which have nothing to do with weather or climate. Can we see the same kind increase also with other disaster types?

Simple answer: Yes. Technological disasters in particular have been increasing considerably based on EMDAT database. Of course some of this increase is real: all countries – not just western industrialized countries are being more dependent on technology. And this – together with population increase – also increases the number of technological disasters. But still: the same improvement in reporting as with weather-related disasters can be easily seen from this graph.
Data sources
While trying to find some information about the EM-DAT history, I found something interesting (3). The document released 2004 provides interesting insights of EM-DATA data sources during the years and will explain quite well what we saw above: Why the increase of observations and reporting will explain the “increase” of natural disasters.
This diagram is from the document released by EM-DAT maintainers:

Figure: Reporting sources for EM-DAT database between 1974-2002
Natural disaster reports are provided by a number of sources and there seem to be significant evolution of EM-DAT reporting scheme during the years. Significant “increase” of natural disasters by around 1999 seems to be explained entirely by a new source of data “specialized agencies”. Specialized agencies refer to sources like e UN World Food Programme, the World Health Organization or the US National Oceanic and Atmospheric Administration.
It is also good to notice how small source the “Governments” actually are. Majority of data comes from either UN organizations or from insurance companies. This itself explains the data (un)availability from former Soviet Union, Pre-1990s China and Eastern Block countries – No UN organization nor global insurance companies had any meaningful presence on those countries. Insurance companies are interested on insured wealth only. And that has been tremendous increase of insured wealth during the decades.
Thus, it seems that the data collection during the years has not been stable and based on scientifically stable sources.
Summary
- EM-DAT data collection methods have significantly evolved during the years rendering trend analysis totally invalid
- Therefore EM-DAT database data has not scientific value when considering disaster trends
- UN report does not take in account the significant increase of world population, which by itself explains all increase of affected people
- All conclusions made about the increase of natural disasters based on this database should be retracted
REFERENCES
- EM-DAT, CRED / UCLouvain, Brussels, Belgium – www.emdat.be (D. Guha-Sapir)
- Pielke, R. (2020). Economic ‘normalisation’ of disaster losses 1998–2020: a literature review and assessment. Environmental Hazards, 1-19.
- D. Guha-Sapir D. Hargitt P. Hoyois, Thirty years of natural disasters 1974-2003: the numbers, centre for Research on the Epidemiology https://www.unisdr.org/files/1078_8761.pdf
- WMO Atlas of Mortality and Economic Losses from Weather, Climate and Water Extremes (1970 – 2019)
- R code to generate all graphs in this post

I´ve seen statistic from the USA, that shows a lot more storms, typhoons, flooding, etc from the beginning of 1900. Tony Heller provides lots of it on youtube. There are lots of accurate stats from that time.
LikeLike
And yet that same database, with its misleading increase in natural disasters, shows a decline in deaths. So does this mean the real decline is even greater?
LikeLike
That’s the only conclusion that can be made.
LikeLike
Excellent piece of analysis.
LikeLike