
By Pasi Autio

A New Study “The burden of heat-related mortality attributable to recent human-induced climate change” published on Nature Climate Change makes case that one-third of the heat-related deaths in many cities around the world can be attributable to Climate Change. A very strong claim indeed. The study has got wide publicity in high-profile media, such as in New York Times.
Study claims that Climate Change can explain by an average of 37.0% of heat-related mortality on 732 locations in 43 countries covered.
The make such claim you would need to establish the following:
- Extreme temperatures have indeed increased on study locations
- Temperature increase during the study period is not due to other factors such as urban heat island effect
- There really is an increase of mortality due to heat
- The increase in mortality is not due to increase of population
- The increase in mortality is not due to share of elderly citizens being higher
- No other factors have an effect on mortality such as non-heat-related natural disasters
Let’s review how this study covers those questions to establish their case.
Study methods
Study analyses the data in two steps. First they generate association model between daily mortality and daily temperature:
As described in detail in the Methods, a first-stage model estimates associations for each
location, which are then pooled in a meta-analysis (the second stage). The observed temperature and mortality data were collected through the Multi-Country Multi-City (MCC) Collaborative Research Network, the largest weather and health data consortium to date (https://mccstudy.lshtm.ac.uk).
They don’t provide the full dataset as a part of the supplemental data, but they do provide R-code and sample dataset. From the sample dataset we can see the following source data for each location:
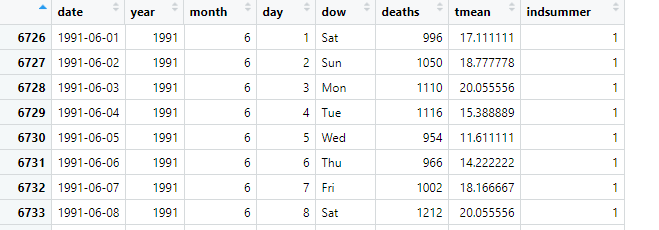
Date, deaths and temperature. The basic assumption seems to be that high temperature directly affects the mortality. Hold on! Where is the total population or age distribution data? Such details seem to be considered as trivial information, which is not needed for state-of-art analysis.
In many countries the population within study location might have been increasing considerably already during the 10 years. And the same applies to percentage of senior citizens, which is increasing the heat-related mortality on many study locations.
The second step they make is to establish “Climate Change”-related mortality is as follows:
In the second step, we used the estimated exposure-response
functions to compute the heat-related mortality burden between
1991 and 2018 for each location under two scenarios: a factual
scenario consisting of simulations of historical climate (all climate
forcings) and a counterfactual scenario where climate simulations
are driven by natural forcings only, thus approximating the climate
that would have occurred in a world without human-induced or
anthropogenic climate change
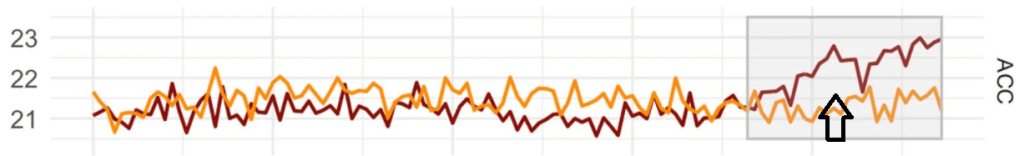
The figure above is a sample from the extended data figure 1 from the study. For each location they define “factual” (= temperature series from Climate Models based on natural and anthropogenic forcings) and “counterfactual” (= temperature series from Climate Models based on natural forcings only). Daily mortality is then calculated with the model generated in analysis phase 1. The “additional” mortality due to Climate Change is difference of those two between years 1991-2018.
Really straightforward: Just assess the temperature – mortality relationship and then consider how much the temperature has increased due to human influence by using Climate Models. End-result is the percentage of heat-related mortality caused by Climate Change. Forget about real mortality and temperature data. You don’t need them – you already have modelled data. Also ignore all pre-1991 data; assume all temperature changes during that era to be natural and all changes after that to be caused by anthropogenic forcings.
Straightforward and totally wrong. Instead of evaluating all factors listed earlier (1 to 7) they consider none of them. To prove the point, let’s analyze couple of locations in more detail.
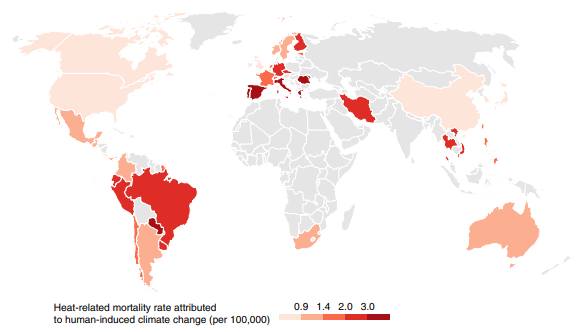
The figure above is provided as a part of study. The analysis of all 732 locations would require considerable time and effort for data collection, so let’s concentrate on three countries, which are highlighted with high “Heat-related mortality rate attributed to climate change”.
Let’s start with Finland:
Heat-related mortality in Finland
Study finds Northern European country Finland and the capital city Helsinki to have high heat-related death rate. Really? Finland? My home country is not exactly known for high temperatures or long heat waves. Most of the Finns wait for decent summer temperatures, which is considered to be over 25 Celsius. There is even a Finnish word “helle” for this sunny summer weather and when the “helle” arrives, this is good news for majority of Finns every summer. That’s when ice cream sales go to roof and drowning accidents fill the newspapers.
To make the case for increased temperatures, we first need to establish whether these “heat waves” have increased in Finland. For capital of Finland we have temperature data available for years between 1844-2021. Let’s count for days with temperature maximum of over 25 Celsius for each year:
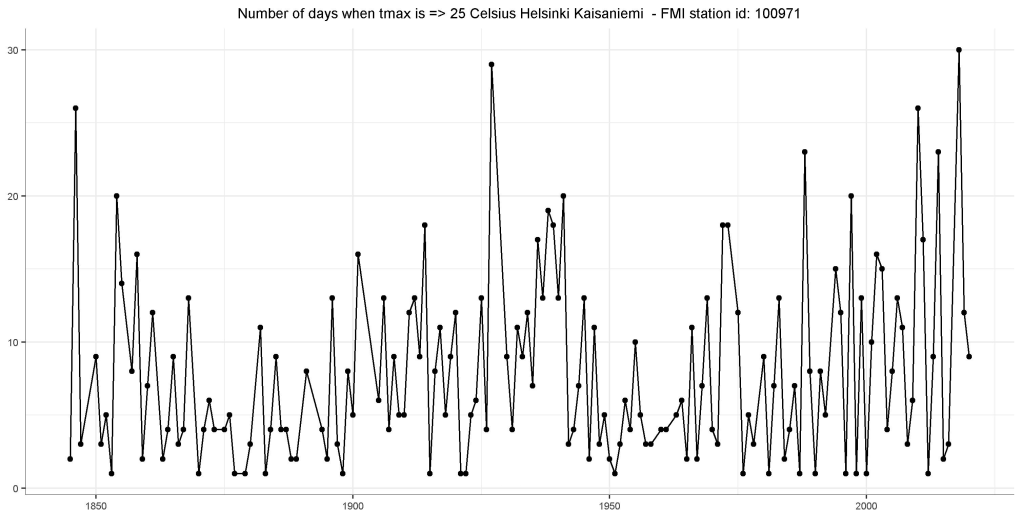
What we can see is no significant increase of => 25 Celsius days during the history of Helsinki Kaisaniemi data. Slight increase at the end does not significantly differ from 1930s and 1940s. Also consider increased Urban Heat Island effect: Helsinki population is now much higher than in 1940s. So for Helsinki the point 1: “Extreme temperatures have indeed increased on study locations” is only partially correct.
If you limit the study just to years 1991-2018, you might (incorrectly) attribute the increase of warm days to Climate Change.
How about the mortality?
To study the mortality I downloaded the following data from the Statistics Finland open data for years 1945-2020:
- Total Population
- Deaths during months of June, July and August
- Deaths on other months
- Population data for age groups over 85
- Deaths for age group over 85
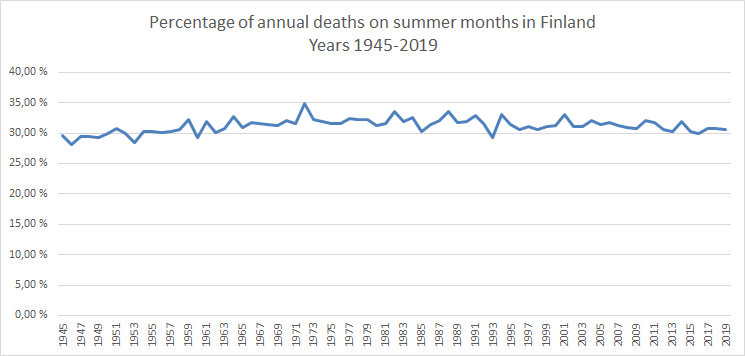
I calculated a trend for mortality on Summer months (June, July and August) vs. all deaths during the same year. The percentage is extremely stable and even slight decreasing during years Nature study years 1991-2018 while considering that population in age group 85 years or older has increased 10-fold between 1945-2019 and by factor of 3 between 1991 and 2019. Elderly people tend to be more vulnerable to high temperatures, but even so that effect is not visible in the data. We can also calculate the percentage of Finnish population dying during summer months. The trend is steadily down between 1945 and 2019.
In summary: Data does not indicate any kind of increase of mortality during summer months.
Heat-related mortality in Spain
Spain is even more dark red in the Nature study being highly vulnerable heat-related increase of mortality.
Fortunately for Spain there is an another study available:
Achebak H, Devolder D, Ballester J (2018) Heat-related mortality trends under recent climate warming in Spain: A 36-year observational study. PLoS Med 15(7): e1002617. https://doi.org/10.1371/journal.pmed.1002617
This study covers 47 major cities from Spain for summer months between 1980 and 2015. This study uses real mortality data and temperatures for this period – not just models as this Nature study does.
Did they find increasing mortality? No they did not.
They did find increasing temperatures with the increase of 0.32 Celsius per decade. But the overall mortality rate is decreasing.
The temporal pattern of each cause of death was similar in men and women (S2 Fig), with a decline in the number of deaths from circulatory diseases and an increase in the number of deaths from respiratory diseases. Nevertheless, mortality decreased at a slower pace in women for circulatory diseases, therefore increasing the magnitude of the difference between women and men. Moreover, for respiratory diseases, mortality increased at a faster pace in women, therefore reducing the magnitude of the difference between women and men.
Achebak H, Devolder D, Ballester J (2018)
Blue and red lines in the figure presents time-varying annual RR curves based on summer 1984 (coolest summer of the period) and red line is based on year 2003 (hottest summer of the period). Mortality rate for similar temperatures is decreasing as a whole for the study period.
The study pointed to a strong reduction in cause-specific and cause-sex mortality RR associated with summer temperatures for the last three and a half decades and, with the exception of respiratory diseases (for men and women together, and for women only), downward trends in heat-attributable deaths. These results strongly support the hypothesis that the observed warming trend in summer temperatures in Spain has not been paralleled by a general increase in the mortality fraction attributable to heat, as a result of substantial decline in population vulnerability to warm temperatures.
Downward trend in spite of portion of people aged over 64 has increased considerably during the years. But why? Study also provides answer for this:
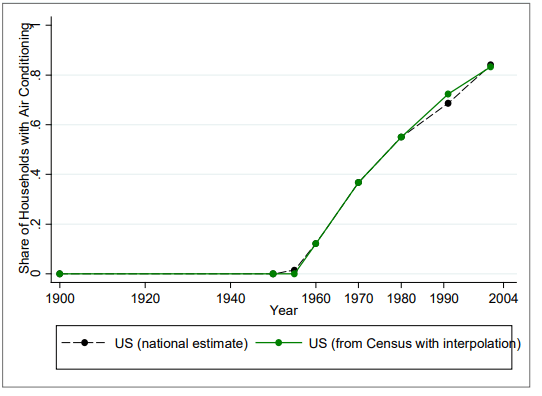
The general downward trend in mortality risks has been attributed by some investigators to socioeconomic development and structural transformations, such as improvements in housing and healthcare services , or even to specific public health interventions. The large socioeconomic advances that occurred in Spain during the last decades might have also contributed to this response, thus reducing the effect of mortality risks over time. For example, the gross domestic product (from €8,798 per capita in 1991 to €22,813 in 2009), the life expectancy at birth (from 77.08 years to 81.58), the expenditure in healthcare (from €605 per capita to €2,182) and social protection (from €1,845 per capita to €5,746), and the number of doctors (from 3,930 per million inhabitants to 4,760 per million inhabitants) have all largely increased in Spain. In addition, the use of air conditioning, which has been postulated as a major contributor to the reduction in heat-related mortality in the United States, has also experienced a strong increase in Spanish households within the analysed period (from 5.3% to 35.5%).
In summary: It’s all about adaptation. Spanish population have made considerable investments on air conditioning – because they can. Increasing income provides better means to manage the excess heat.
The same adaptation is also visible in the Nature study: Mortality curve starts increasing at higher temperature for locations where the excess heat is norm: Kuwait city, Bangkok etc. It’s difficult to argue any reason why this adaptation would not continue everywhere – and despite of possible Climate Change.
Heat-related mortality in USA
Heat-related mortality was a subject of a study back in 2012. Barreca et al 2012 found remarkable 75% percent decline in chances to die due to extreme heat almost entirely after 1960. The results of the study attributes almost all of this decline to air conditioning with decline in annual extreme heat days also contributing.
Using the most comprehensive set of data files ever compiled on mortality and its determinants
over the course of the 20th century in the United States or any other country, this paper makes two
primary discoveries about mortality during the 20th century. First, we document a remarkable decline inthe mortality effect of temperature extremes: The impact of days with a mean temperature exceeding 80° F has declined by about 75% over the course of the 20th century in the United States, with almost the entire decline occurring after 1960. The result is that there are about 20,000 fewer fatalities annually than if the pre-1960 impacts of mortality still prevailed.
In the present-day USA air conditioning penetration is ~ 90% (of households) while in 1950 it was essentially zero. At the same time the number of days with maximum temperature above 100°F (37.8 °C) has also declined around 75% between years 1931-1959 to 1960-2004 (Source: Barreca at al 2012 table 3).
But still Vicedo-Cabrera et al 2021 reports 25-60% of heat-related mortality to be caused by Climate Change on almost every city in USA. In city of Honolulu this percentage is reported to be 82.2%. Once again we can see the difference between modelled temperatures + mortality and real data.
In Summary: Remarkable decline of heat-related mortality and remarkable decline of days above 100°F will prove Vicedo-Cabrera et al 2021 result invalid for USA.
Conclusion
This rebuttal covered just three countries (Finland, Spain and USA), but already this proves that the methods used in Vicedo-Cabrera et al 2021 are seriously flawed causing results and conclusion to be invalid. It does not matter if – for some reason – the model would work correctly on some countries; It does not for these three example countries and that itself invalidates the paper completely. You simply cannot claim Climate Change to have caused increase of heat-related mortality if the mortality is decreasing in real life. Real data should always override any conclusions from the models.
Summary:
- There is no increased heat-caused mortality due to any reason in these three example countries
- Therefore it is impossible for Climate Change to have any effect on mortality either
- All increases are due to flawed methods, which rely on Climate Models instead of real mortality data
- Even then the study fails to mention any other factors affecting the mortality such as population aging and increase, which should be considered in step 1 of the model they use
- Study claims to have found factual and counterfactual increase of mortality due to Climate Change, but in reality their whole paper provides counterfactual claims
- Adaptation to excess heat is ongoing everywhere automatically when the increasing income allows it
Additional reading
Australia: Cheng et al 2018: “Mortality risk from any temperature exposure did not increase or decrease over time.”
USA: Davis et al 2003: “During the 1980s, many cities, particularly those in the typically hot and humid southern United States, experienced no excess mortality. In the 1990s, this effect spread northward across interior cities. This systematic desensitization of the metropolitan populace to high heat and humidity over time can be attributed to a suite of technologic, infrastructural, and biophysical adaptations, including increased availability of air conditioning.”
Korea and Japan: Lee et al 2018: “Average frequency of heat waves and cold spells increased in the 2010s in Korea and Japan. RRs of heat waves significantly decreased in total population. RRs of cold spells have significantly increased in all regions.”
References
- Vicedo-Cabrera, A.M., Scovronick, N., Sera, F. et al. The burden of heat-related mortality attributable to recent human-induced climate change. Nat. Clim. Chang. (2021). https://doi.org/10.1038/s41558-021-01058-x
- Achebak H, Devolder D, Ballester J (2018): Heat-related mortality trends under recent climate warming in Spain: A 36-year observational study. PLOS Medicine 18(4): e1003627. https://doi.org/10.1371/journal.pmed.1003627
- Jian Cheng, Zhiwei Xu, Hilary Bambrick, Hong Su, Shilu Tong, Wenbiao Hu, Impacts of heat, cold, and temperature variability on mortality in Australia, 2000–2009, Science of The Total Environment https://doi.org/10.1016/j.scitotenv.2018.10.186
- Robert E Davis, Paul C Knappenberger, Patrick J Michaels, and Wendy M Novicoff 2003 Changing heat-related mortality in the United States. https://ehp.niehs.nih.gov/doi/abs/10.1289/ehp.6336
- Whanhee Lee, Hayon Michelle Choi, Jae Young Lee, Da Hye Kim, Yasushi Honda, Ho Kim, Temporal changes in mortality impacts of heat wave and cold spell in Korea and Japan, Environment International, Volume 116 https://doi.org/10.1016/j.envint.2018.04.017
- Barreca, Alan I. and Clay, Karen B. and Deschenes, Olivier and Greenstone, Michael and Shapiro, Joseph S., Adapting to Climate Change: The Remarkable Decline in the U.S. Temperature-Mortality Relationship Over the 20th Century (January 10, 2015). Journal of Political Economy, Forthcoming, Available at SSRN: https://ssrn.com/abstract=2192245 or http://dx.doi.org/10.2139/ssrn.2192245
- Mortality data from Finland; Statistics Finland; stat.fi

Outstanding work, facts based on real data with sources listed, something that most of ”fact checkers” don’t do.
LikeLike