 misuse")

By Pasi Autio 16th of April 2024
Back in 2021 World Meteorological Organization (WMO) claimed five-fold increase of weather-related disasters. The report was called: WMO Atlas of Mortality and Economic Losses from Weather, Climate and Water Extremes (1970 – 2019) with the key message being: “The number of disasters has increased by a factor of five over the 50-year period, driven by climate change, more extreme weather and improved reporting.”
This claim has been quoted on hundreds of different times by different governmental organizations, insurance companies and newspapers. Some recent examples of these quotes follows:
- 2023, UNDDR GAR Special report
- “The number of recorded disasters has increased fivefold over the past 50 years and this trend is accelerating. Exposure is increasing in countries where there is already a large number of people affected by disasters.”
- March 2023, Barclays Bank: “Gloomy forecast: The economic costs of extreme weather”
- “From 1970-2019, the number of extreme weather events has increased by a factor of five, albeit declining slightly between the 2000s and the 2010s, according to data from the World Meteorological Organization (WMO).”
- May 2023, BBC: “Why is extreme weather killing fewer people?”:
- “The number of weather-related disasters has increased five-fold over the same period, according to the WMO.”
- June 2023, World Economic Forum: “The economic costs of extreme weather are soaring, but number of deaths is falling fast. Here’s why”
- “There has been one disaster every day as a result of weather, climate or water hazards over the past 50 years. That’s an average figure provided by the World Meteorological Organization (WMO), which also says the number of such disasters has increased fivefold over this period, hitting 11,778 between 1970 and 2021.”
- December 2023, Reliefweb: “2023 in Review”:
- “While better forecasting, disaster preparedness and management have over the last century reduced the number of people who die from weather-related disasters, the number of global extreme weather events has increased five-fold over the past 50 years according to the World Meteorological Organization.”
- January 2024, Guardian: “War gave us the Red Cross. Now climate disaster means we need a Green Cross too”:
- “According to the UN, climate catastrophes have increased five-fold over the past 50 years”
List goes on and on. Even encyclopaedia of Britannica is on board quoting this claim.
The claim about five-fold increase of disasters in WMO report is based on increase in recorded weather-related disasters in EM-DAT database.
But what is EM-DAT?
EM-DAT is a global database with information on over 26,000 mass disasters from 1900 to present day. It was created to serve the purposes of humanitarian action at national and international levels. The database contains essential core data on the occurrence and effects of mass disasters worldwide. It is compiled from various sources, including UN agencies, humanitarian organizations and insurance companies. EM-DAT is managed by Centre for Research on the Epidemiology of Disasters (CRED).
Everyone can access the EM-DAT database by registering as EM-DAT user. Access is free for non-profit organizations, so you just need to register. You can download the whole database of disasters between 1900 and present. Data contains up to 43 different columns of information for each disaster – for most disasters only less than half of the columns has any data.
Database includes disasters with following categories:
- Climatological – Droughts, wildfires
- Hydrological – Floods, Landslides
- Meteorological – Storms, extreme temperatures
- Geophysical – Volcanic activity, earthquakes
- Biological – Epidemics, insect infestation
- Technological – Industrial accidents, transport accidents
- Extra-terrestial – Meteor impacts
First three categories can be weather-related and are the key in WMO claims.
Let’s start by plotting a diagram of number of weather-related disasters each year between 1960 and 2024.
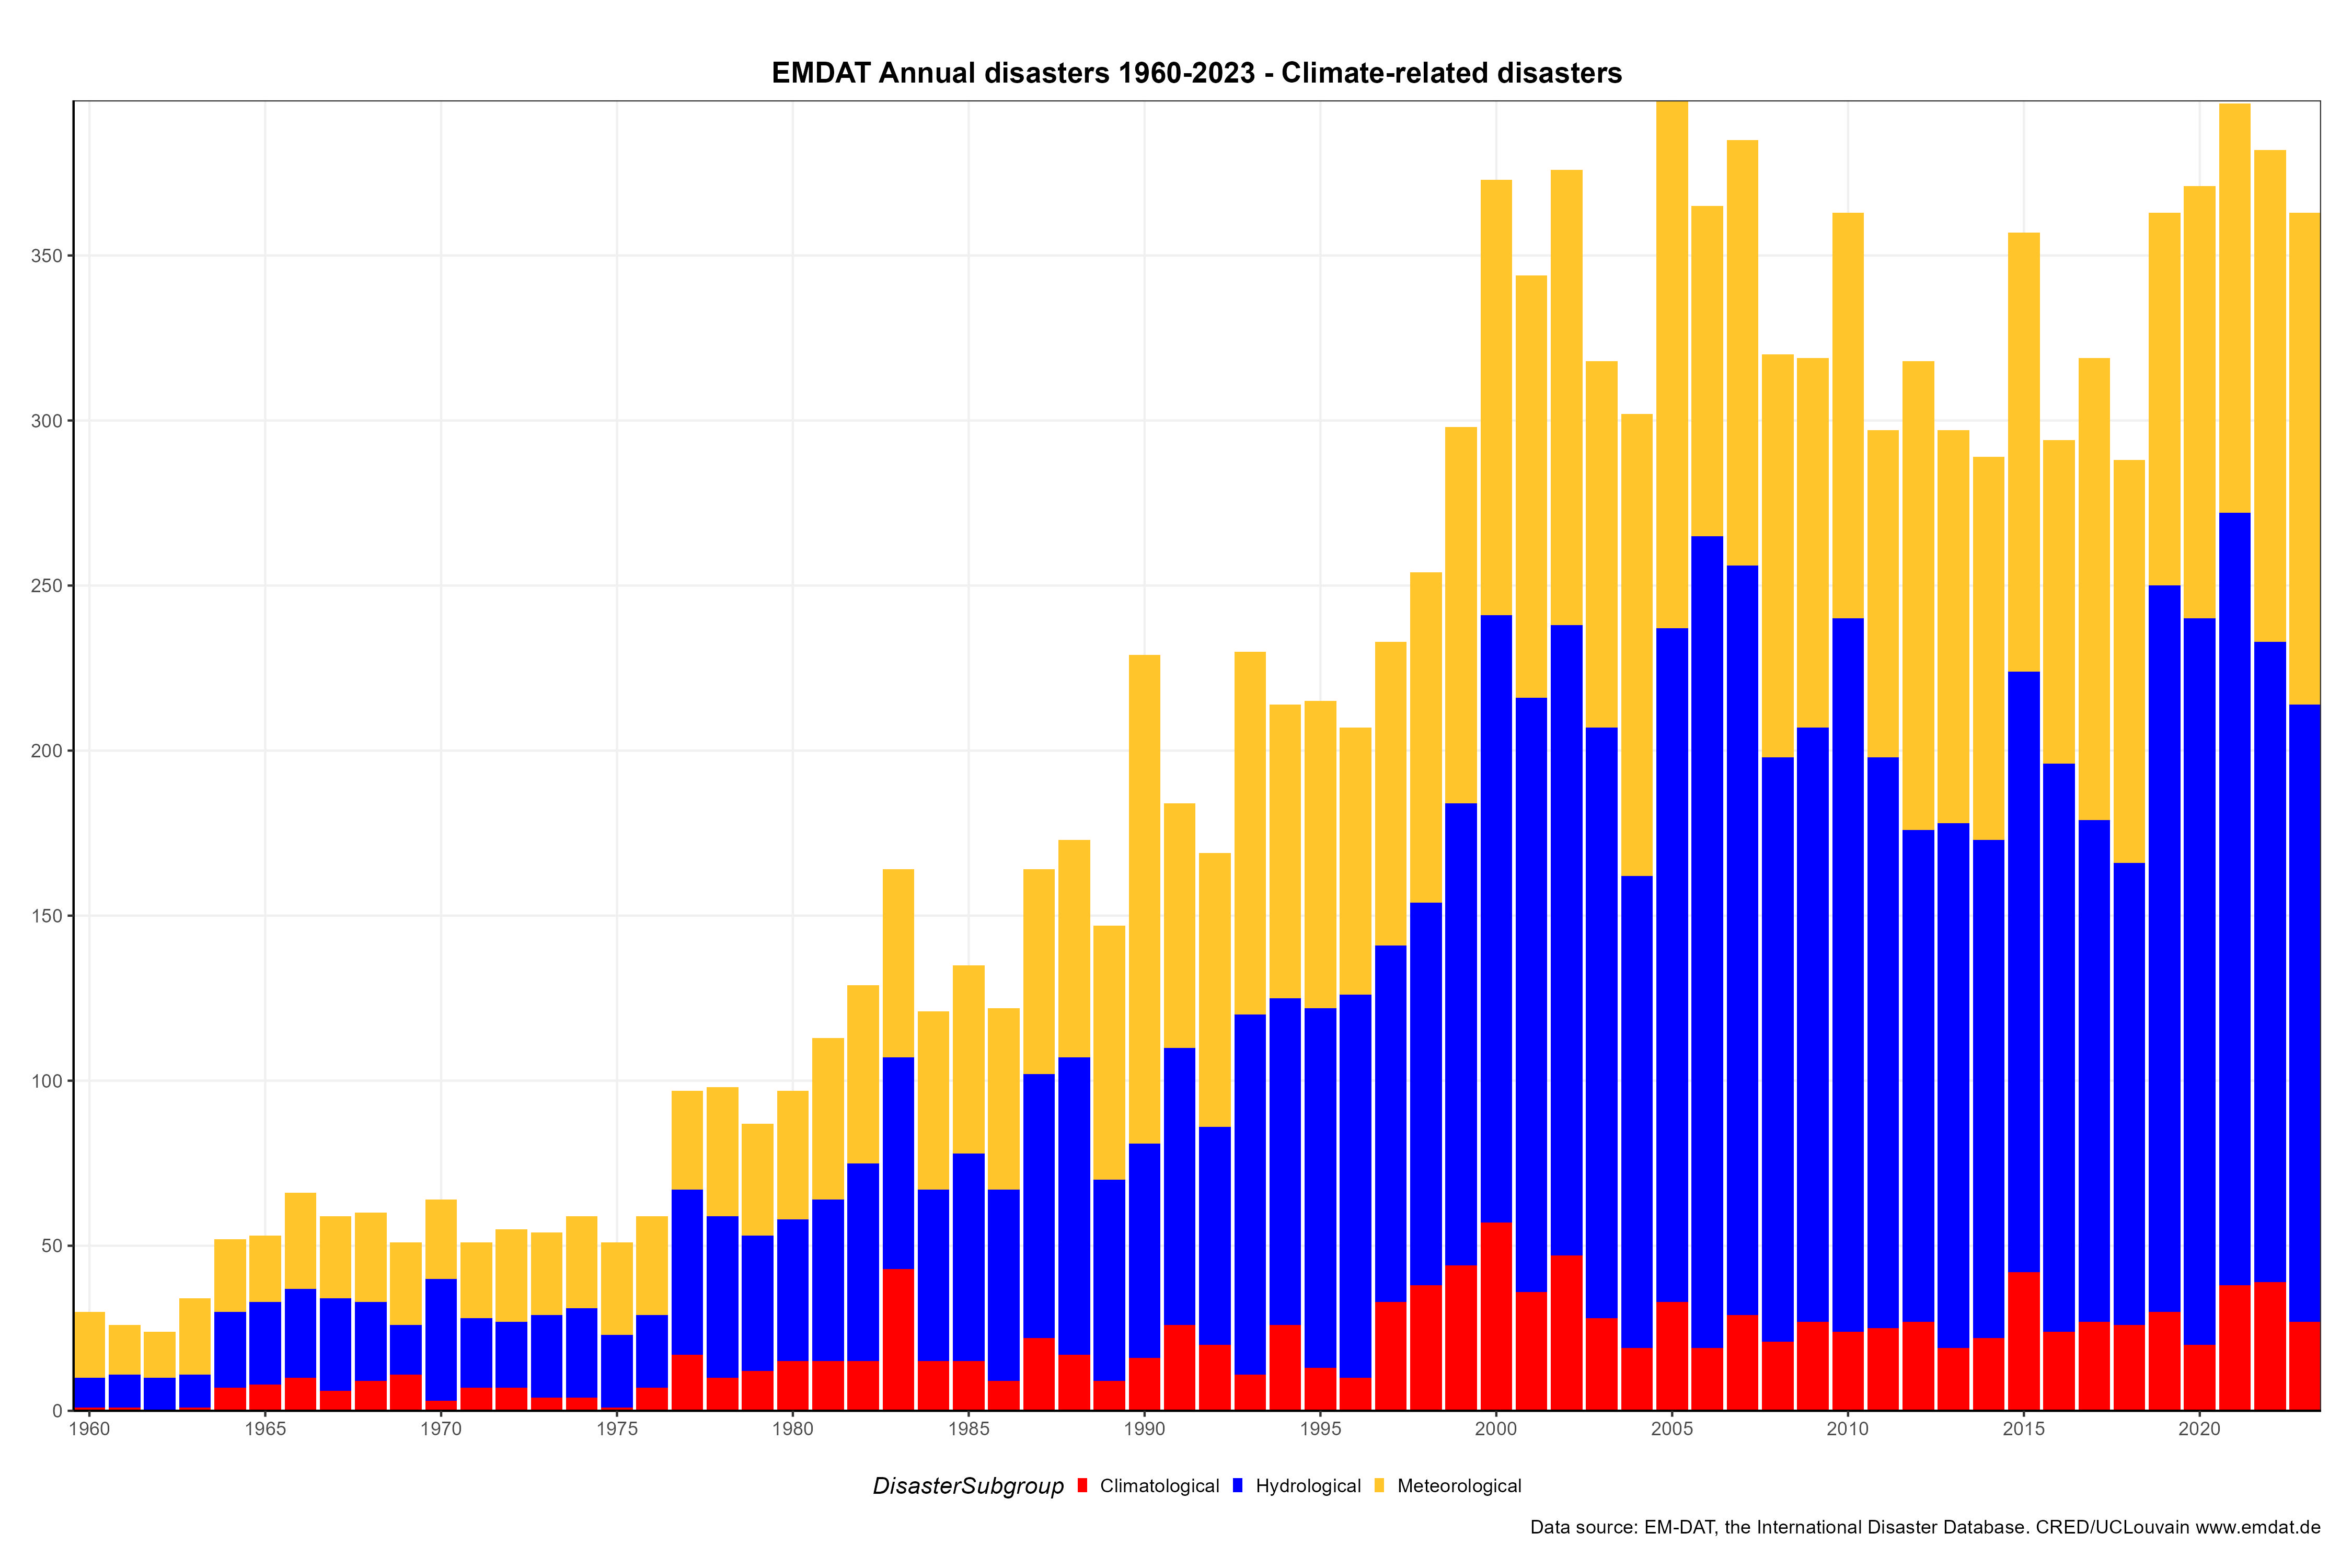
Figure: All weather-related disasters worldwide in EM-DAT database
It’s easy to see where the UN claim comes from. Indeed the weather-related disasters have increased considerably during years 2000-2099 compared to years 1970-1979. But at the same time we see the first hint of what is wrong: There is a gradual increase of disasters from 1960s level to today’s level. If you see this kind of data the first question you have is the reporting: How does the improved reporting and data collection affect the dataset?
EM-DAT Country coverage
Let’s plot the number of countries reporting at least one natural disaster per year between 1960-2024:

Figure: Countries reporting at least one natural disaster each year
From the list of countries reporting at least one disaster we can see huge increase of reporting countries during the years. Also the shape of the data is very similar to the total number of natural disasters plotted earlier.
During 1901, for example, there was only two countries in the database (Japan and Uganda) whereas during 2000-2019 the number of countries reporting was about 120-150 each year. Even the new data has a lot less than countries than there is countries in the world, so it is likely that even the years 2000-2024 are underreporting the actual natural disasters quite heavily while considering that there are number of small countries in the world, which are unlikely to ever face any significant natural disaster (example: Vatican).
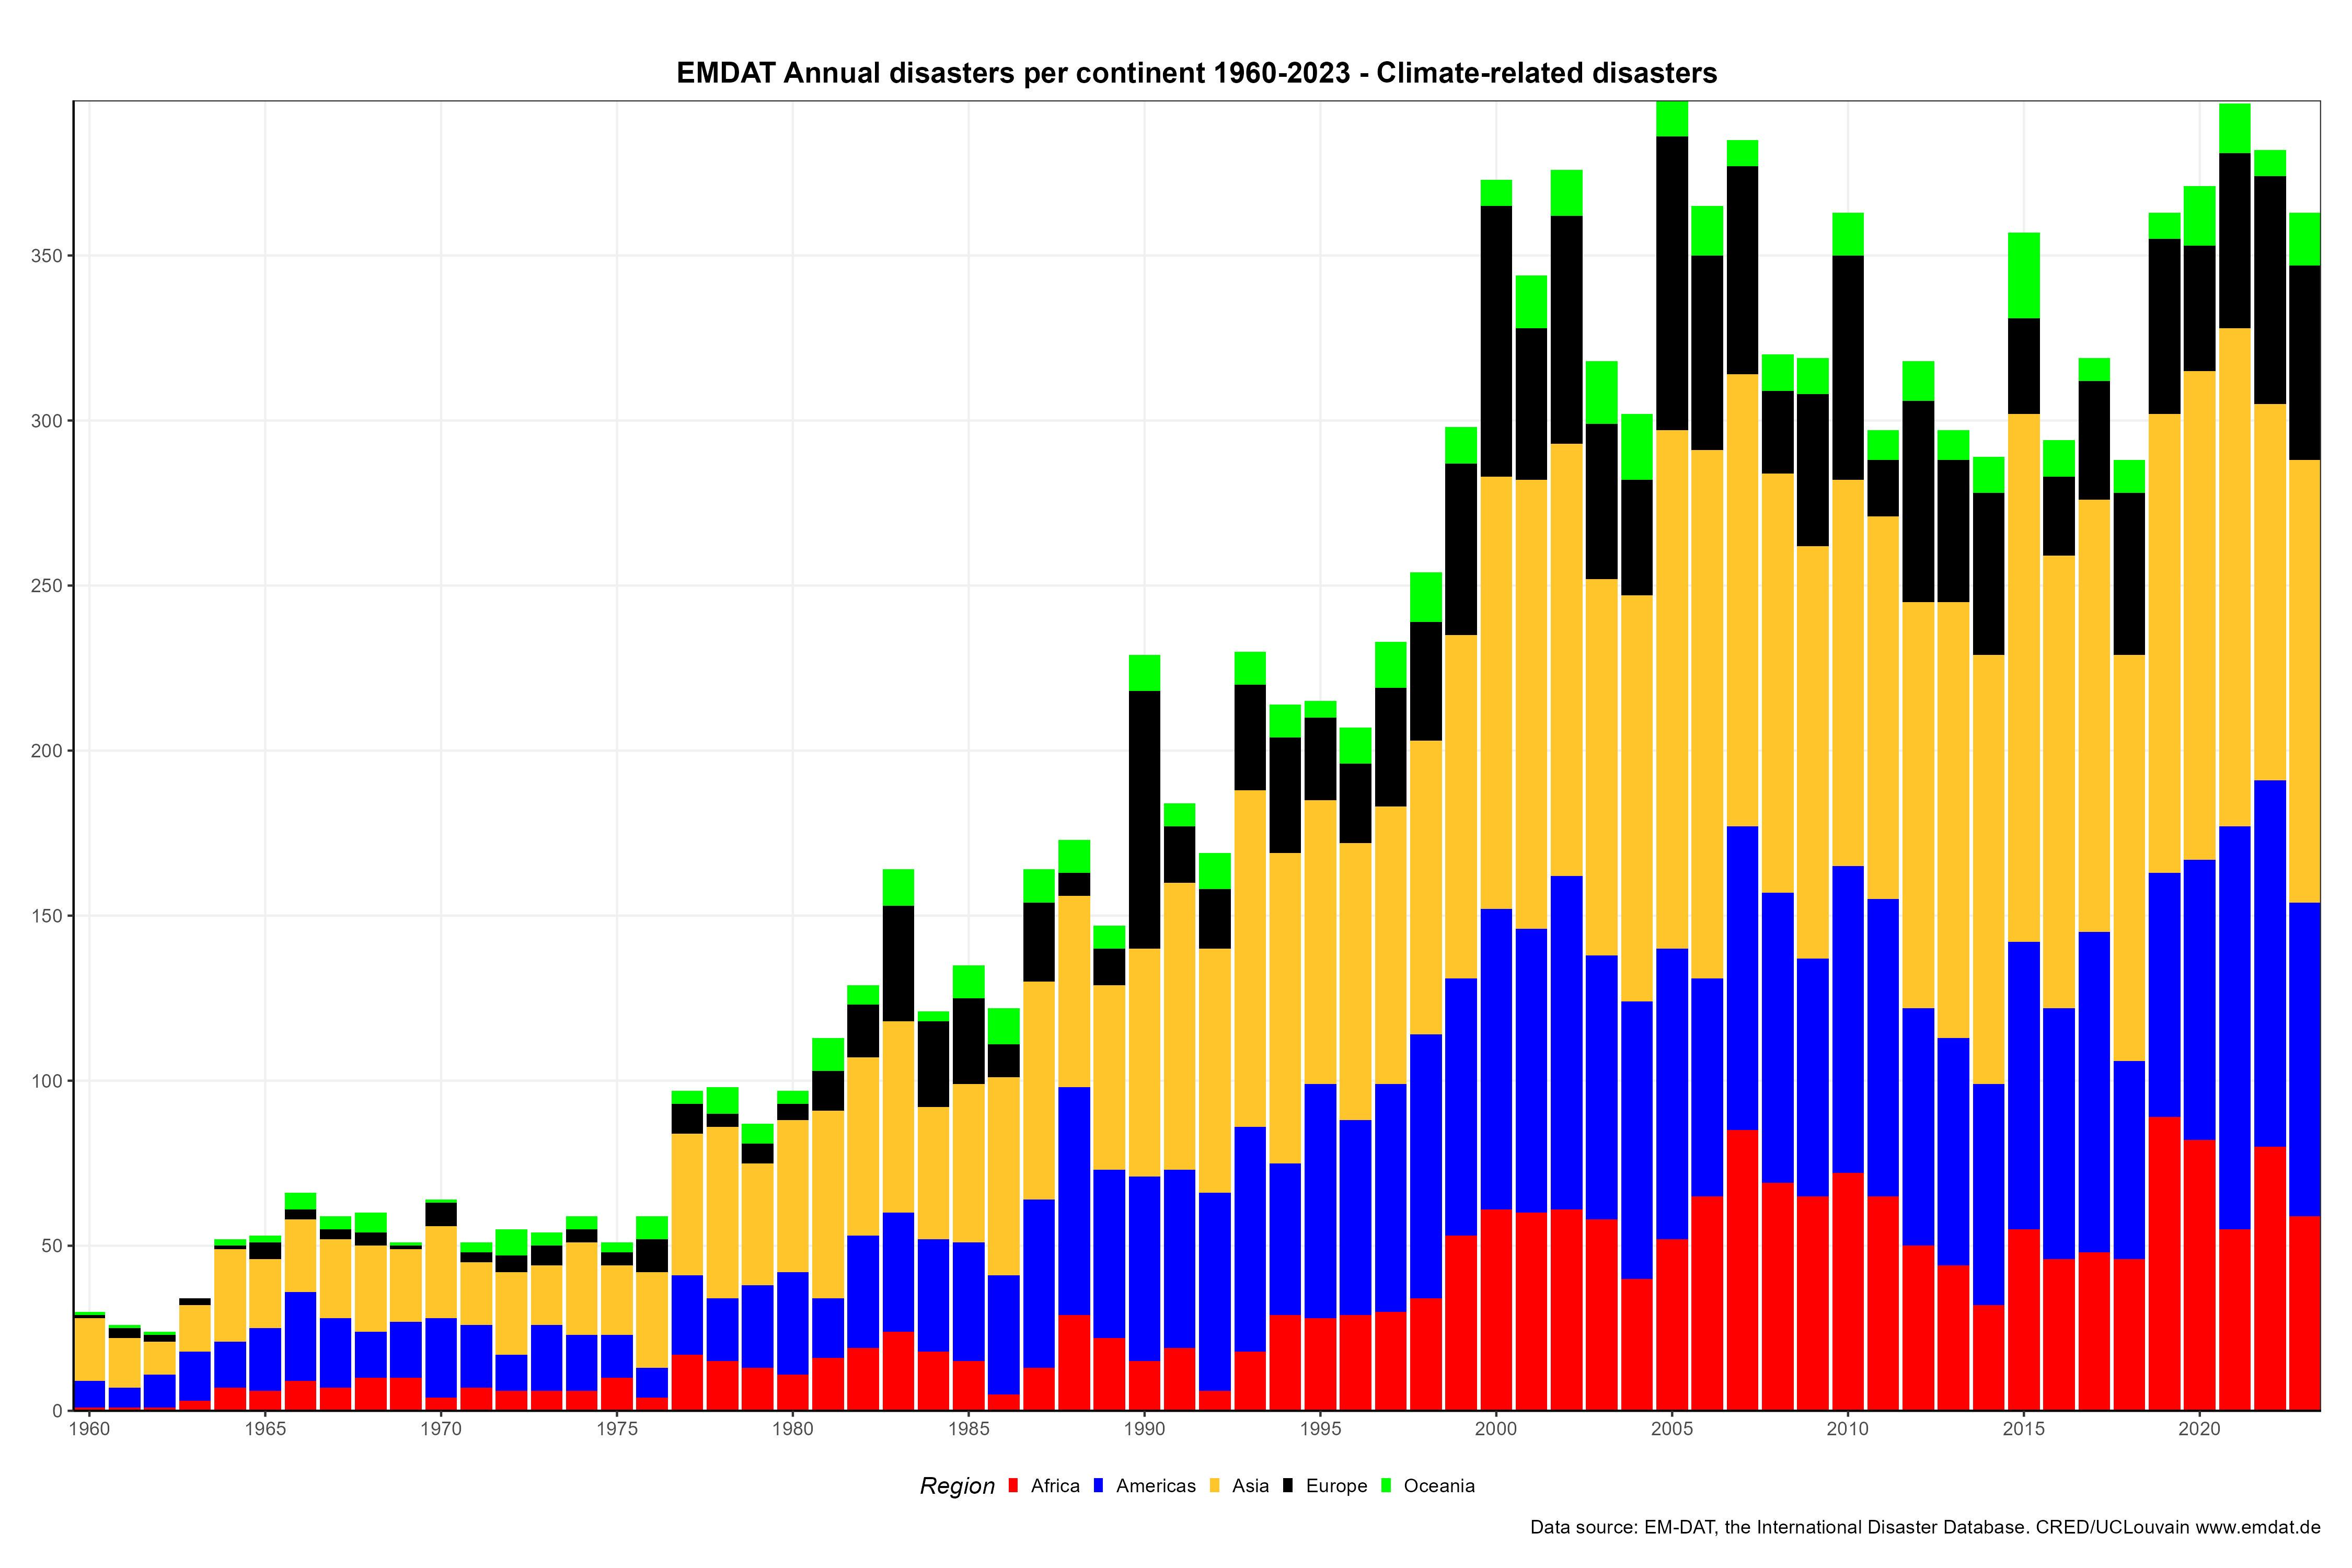
Figure: Evolution of disasters per continent
Similar increase of weather-related disasters can be seen on every continent, but especially in Asia.
EM-DAT coverage for specific countries
In the UN paper the years 1980-2019 are of specific interest. You can see significant increase of reporting countries between 1980 and 2000. After that the number is quite steady. You might think this is due changes like Soviet Union breaking to many different countries, so let’s see how much data EM-DAT has for Soviet Union:
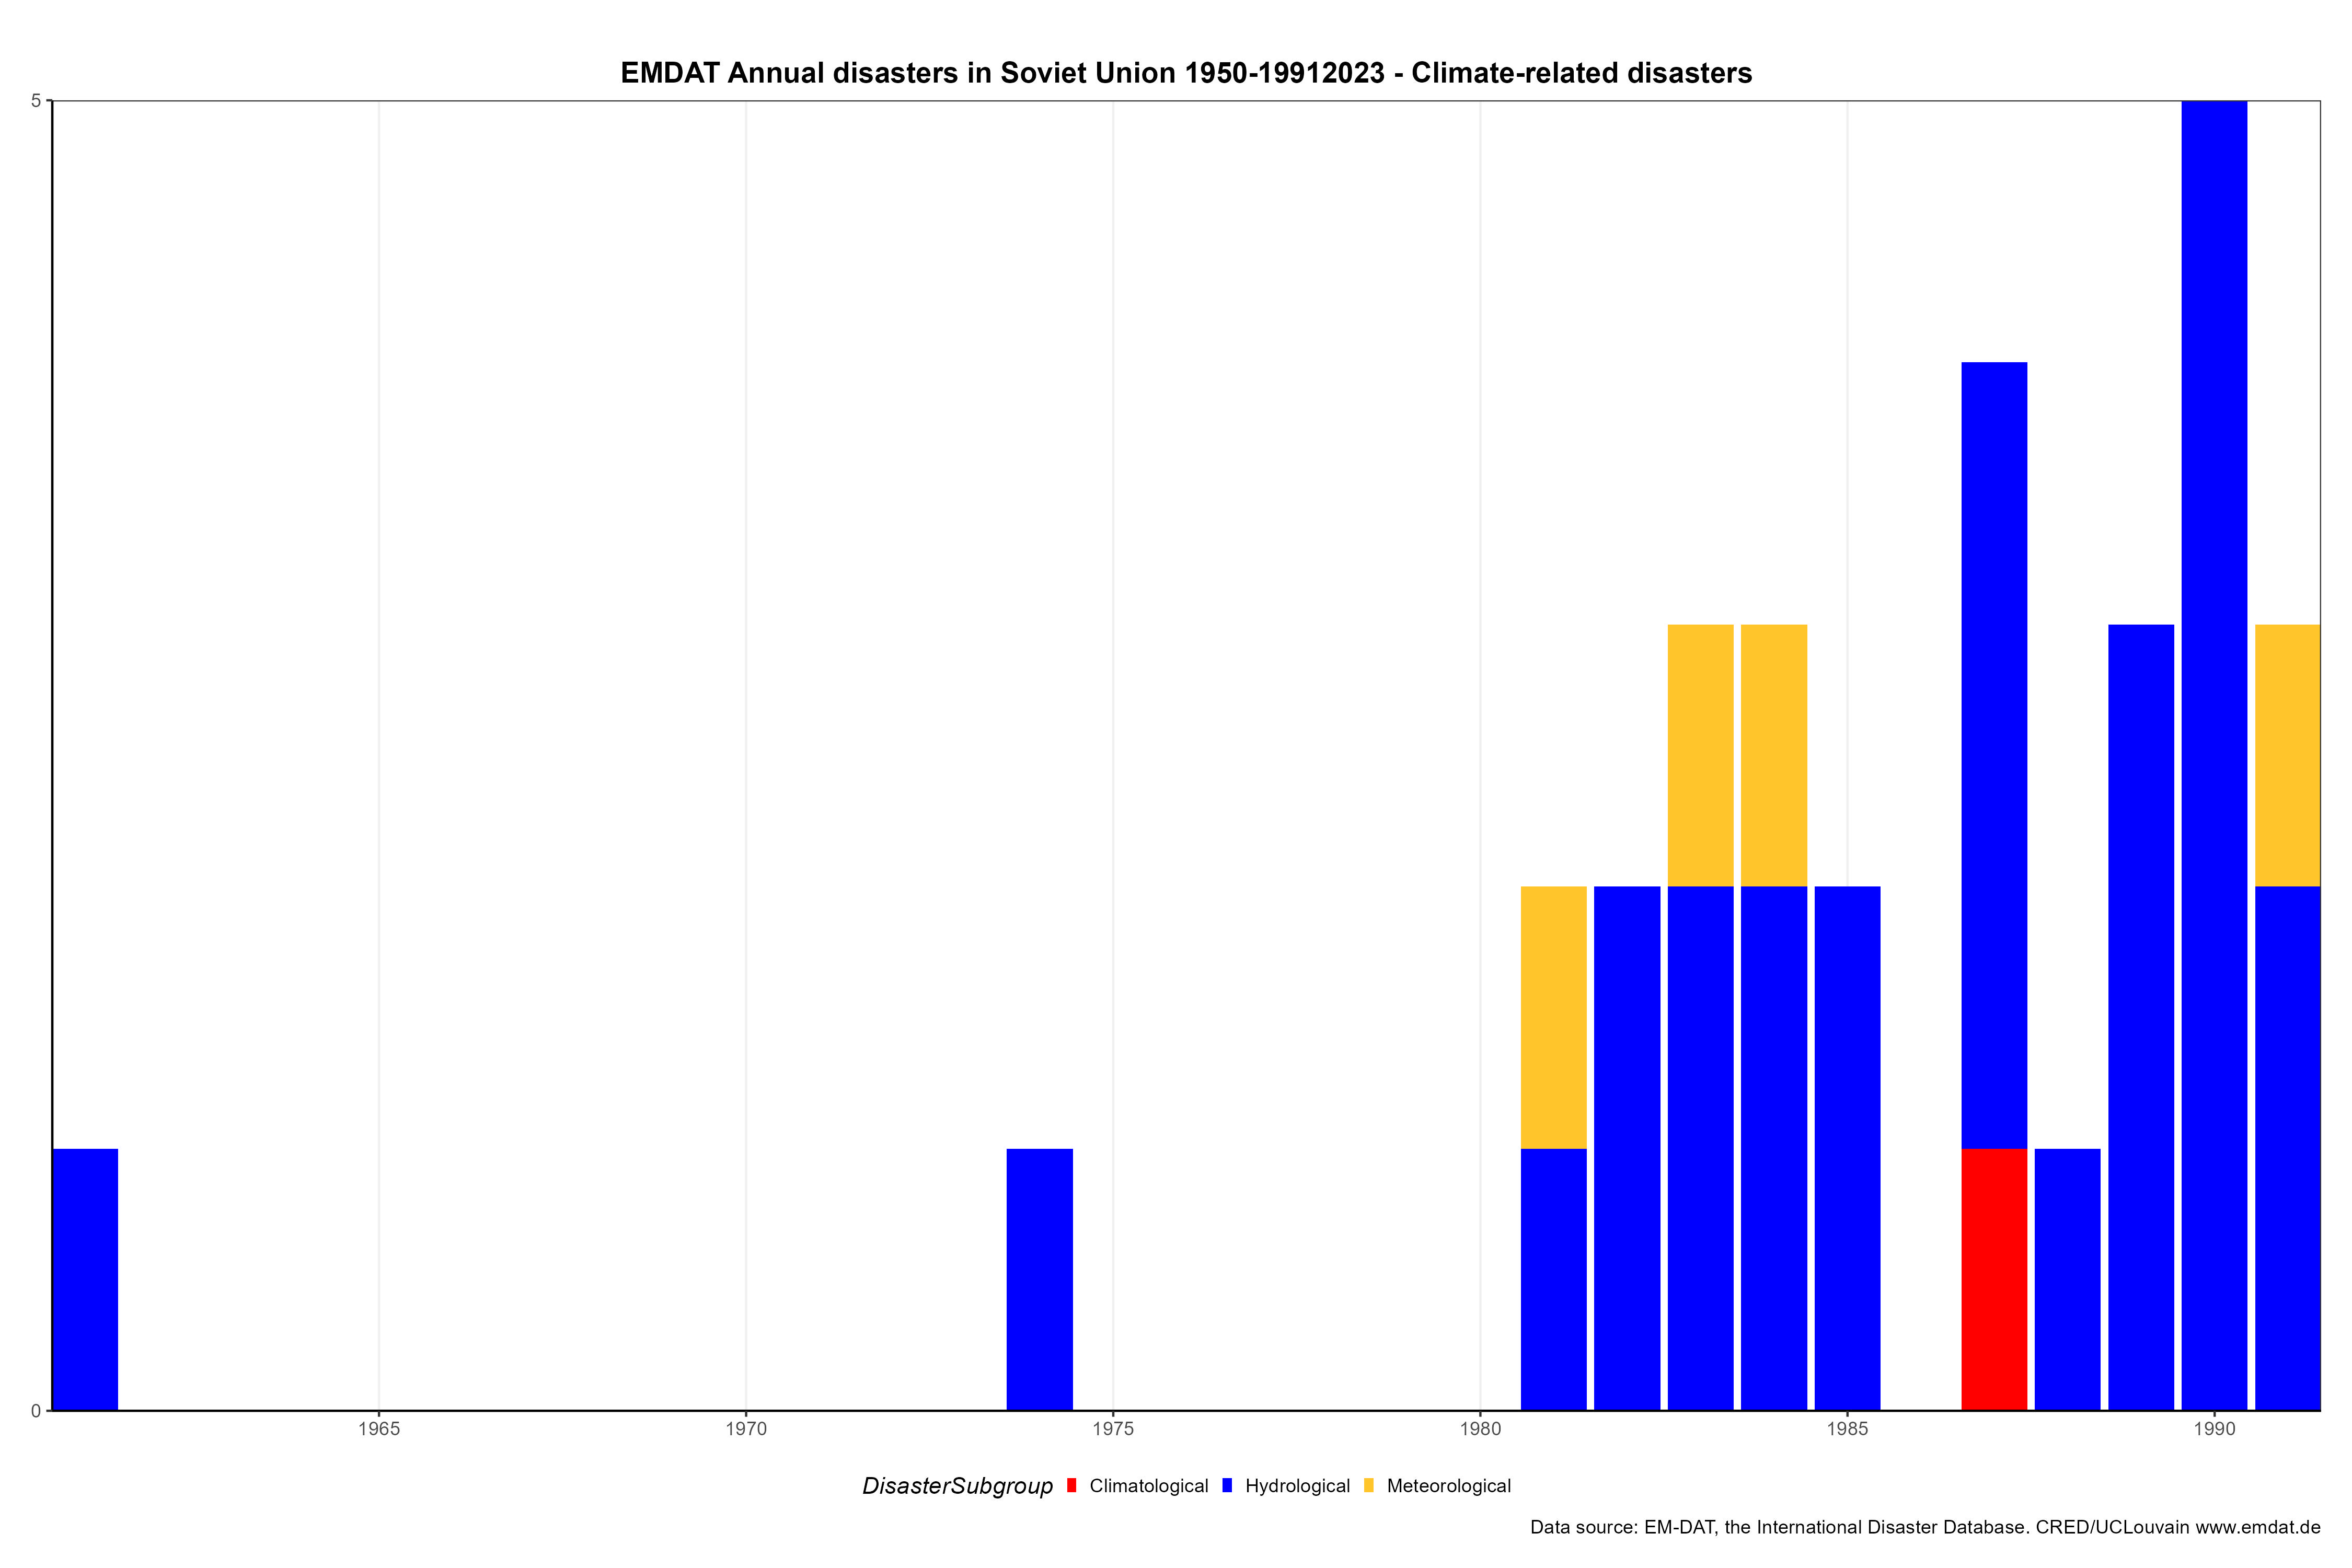
Figure: Natural disasters in Soviet Union for each year between 1950-1991
Not much. For whatever reason, disaster data from Soviet Union is basically absent from EM-DAT database. Soviet Union was not the most open reporter of natural disasters in general and CRED has not been able to collect the relevant disaster data. Therefore the increase of countries reporting natural disaster during 1990s is not the result of Soviet Union breakup. And what is the likelihood of country with the size of Soviet Union having only 0-4 weather-related disasters per year? You can easily conclude that this database contains only small portion of real weather-related disasters what happened in Soviet Union. Just the forest fires should have tens of reported incidents every year.
And by the way, it seems that the same “issue” of under-reporting of disasters seems to affect all former Eastern Bloc countries; almost all of them has a huge increase of natural disasters in the database after breakup of Soviet Bloc at 1991. Yugoslavia, for example, reported 0-2 natural disasters per year, but the just Serbia alone is reporting more than that. Clearly the entry criteria is not comparable between pre- and post-Yugoslavia era.
What about China? China was specifically mentioned in the UN report as a country with significant increase of natural disasters:

Figure: Weather-related disasters in China for each year between 1950-2023
You can see that for years before 1980 there is no meaningful data in the EM-DAT database. The reporting increases gradually after 1980 and reaching “steady state” around year 2000.
For 1980 the database contains just 5 disasters in China: Four floods and one tropical cyclone (there where several cyclones making onshore at China during 1980). The peak year 2013 contains over 30 disasters: Droughts, Extreme temperatures, Storms, Floods. The effect of better reporting year-by-year can be easily seen. Communist China was not the most open reporter of natural incidents either.
How about USA? Modern western civilization must have really good disaster reporting already in 1970s, right?
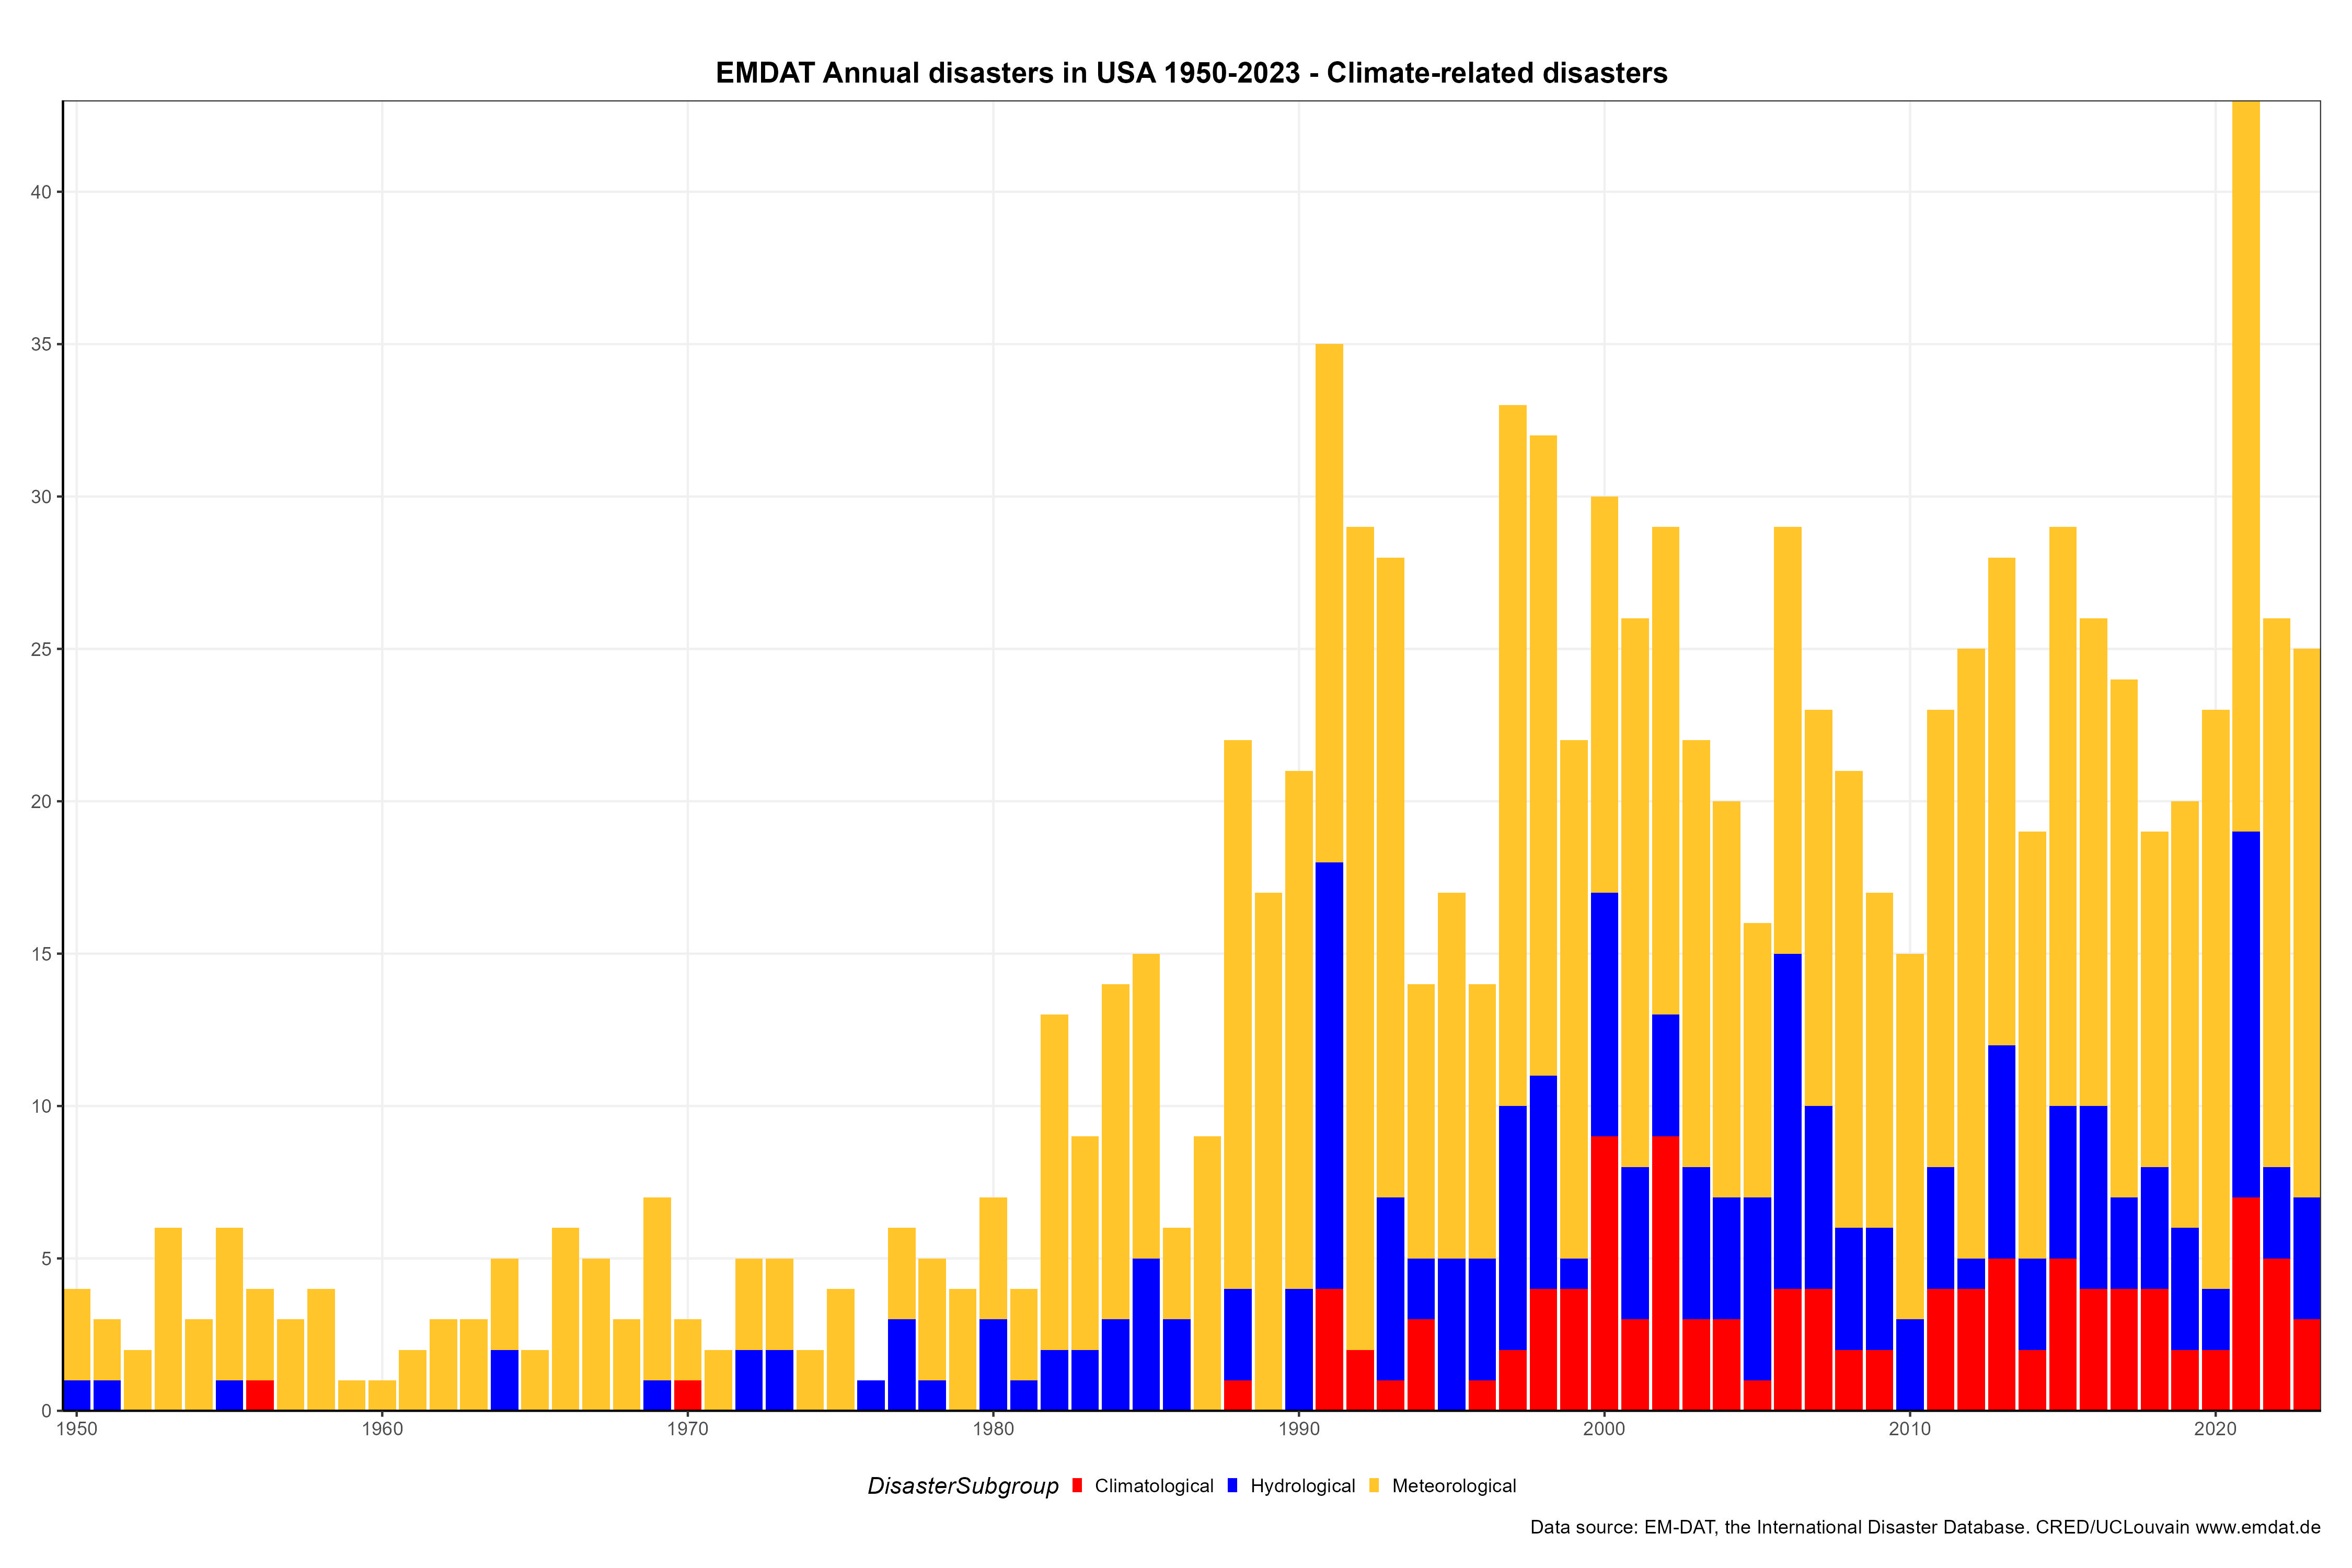
Figure: Weather-related disasters in USA for each year between 1950-2023
For 1980 the database contains just 8 natural disasters in USA: 4 floods, 3 storms, one volcanic activity (St. Helens) and one heat wave.
No tornadoes are present in the database for 1980, but a little study from Wikipedia tells us that year 1980 was below average tornado year with 28 tornado deaths and several bad outbreaks such as 1980 Kalamazoo tornado outbreak and 1980 Grand Island tornado outbreak. In total the season had 866 reported tornadoes. So, the EM-DAT database is just missing all these events.
Speaking of tornadoes, let’s see how much tornado data is available in the EM-DAT database:
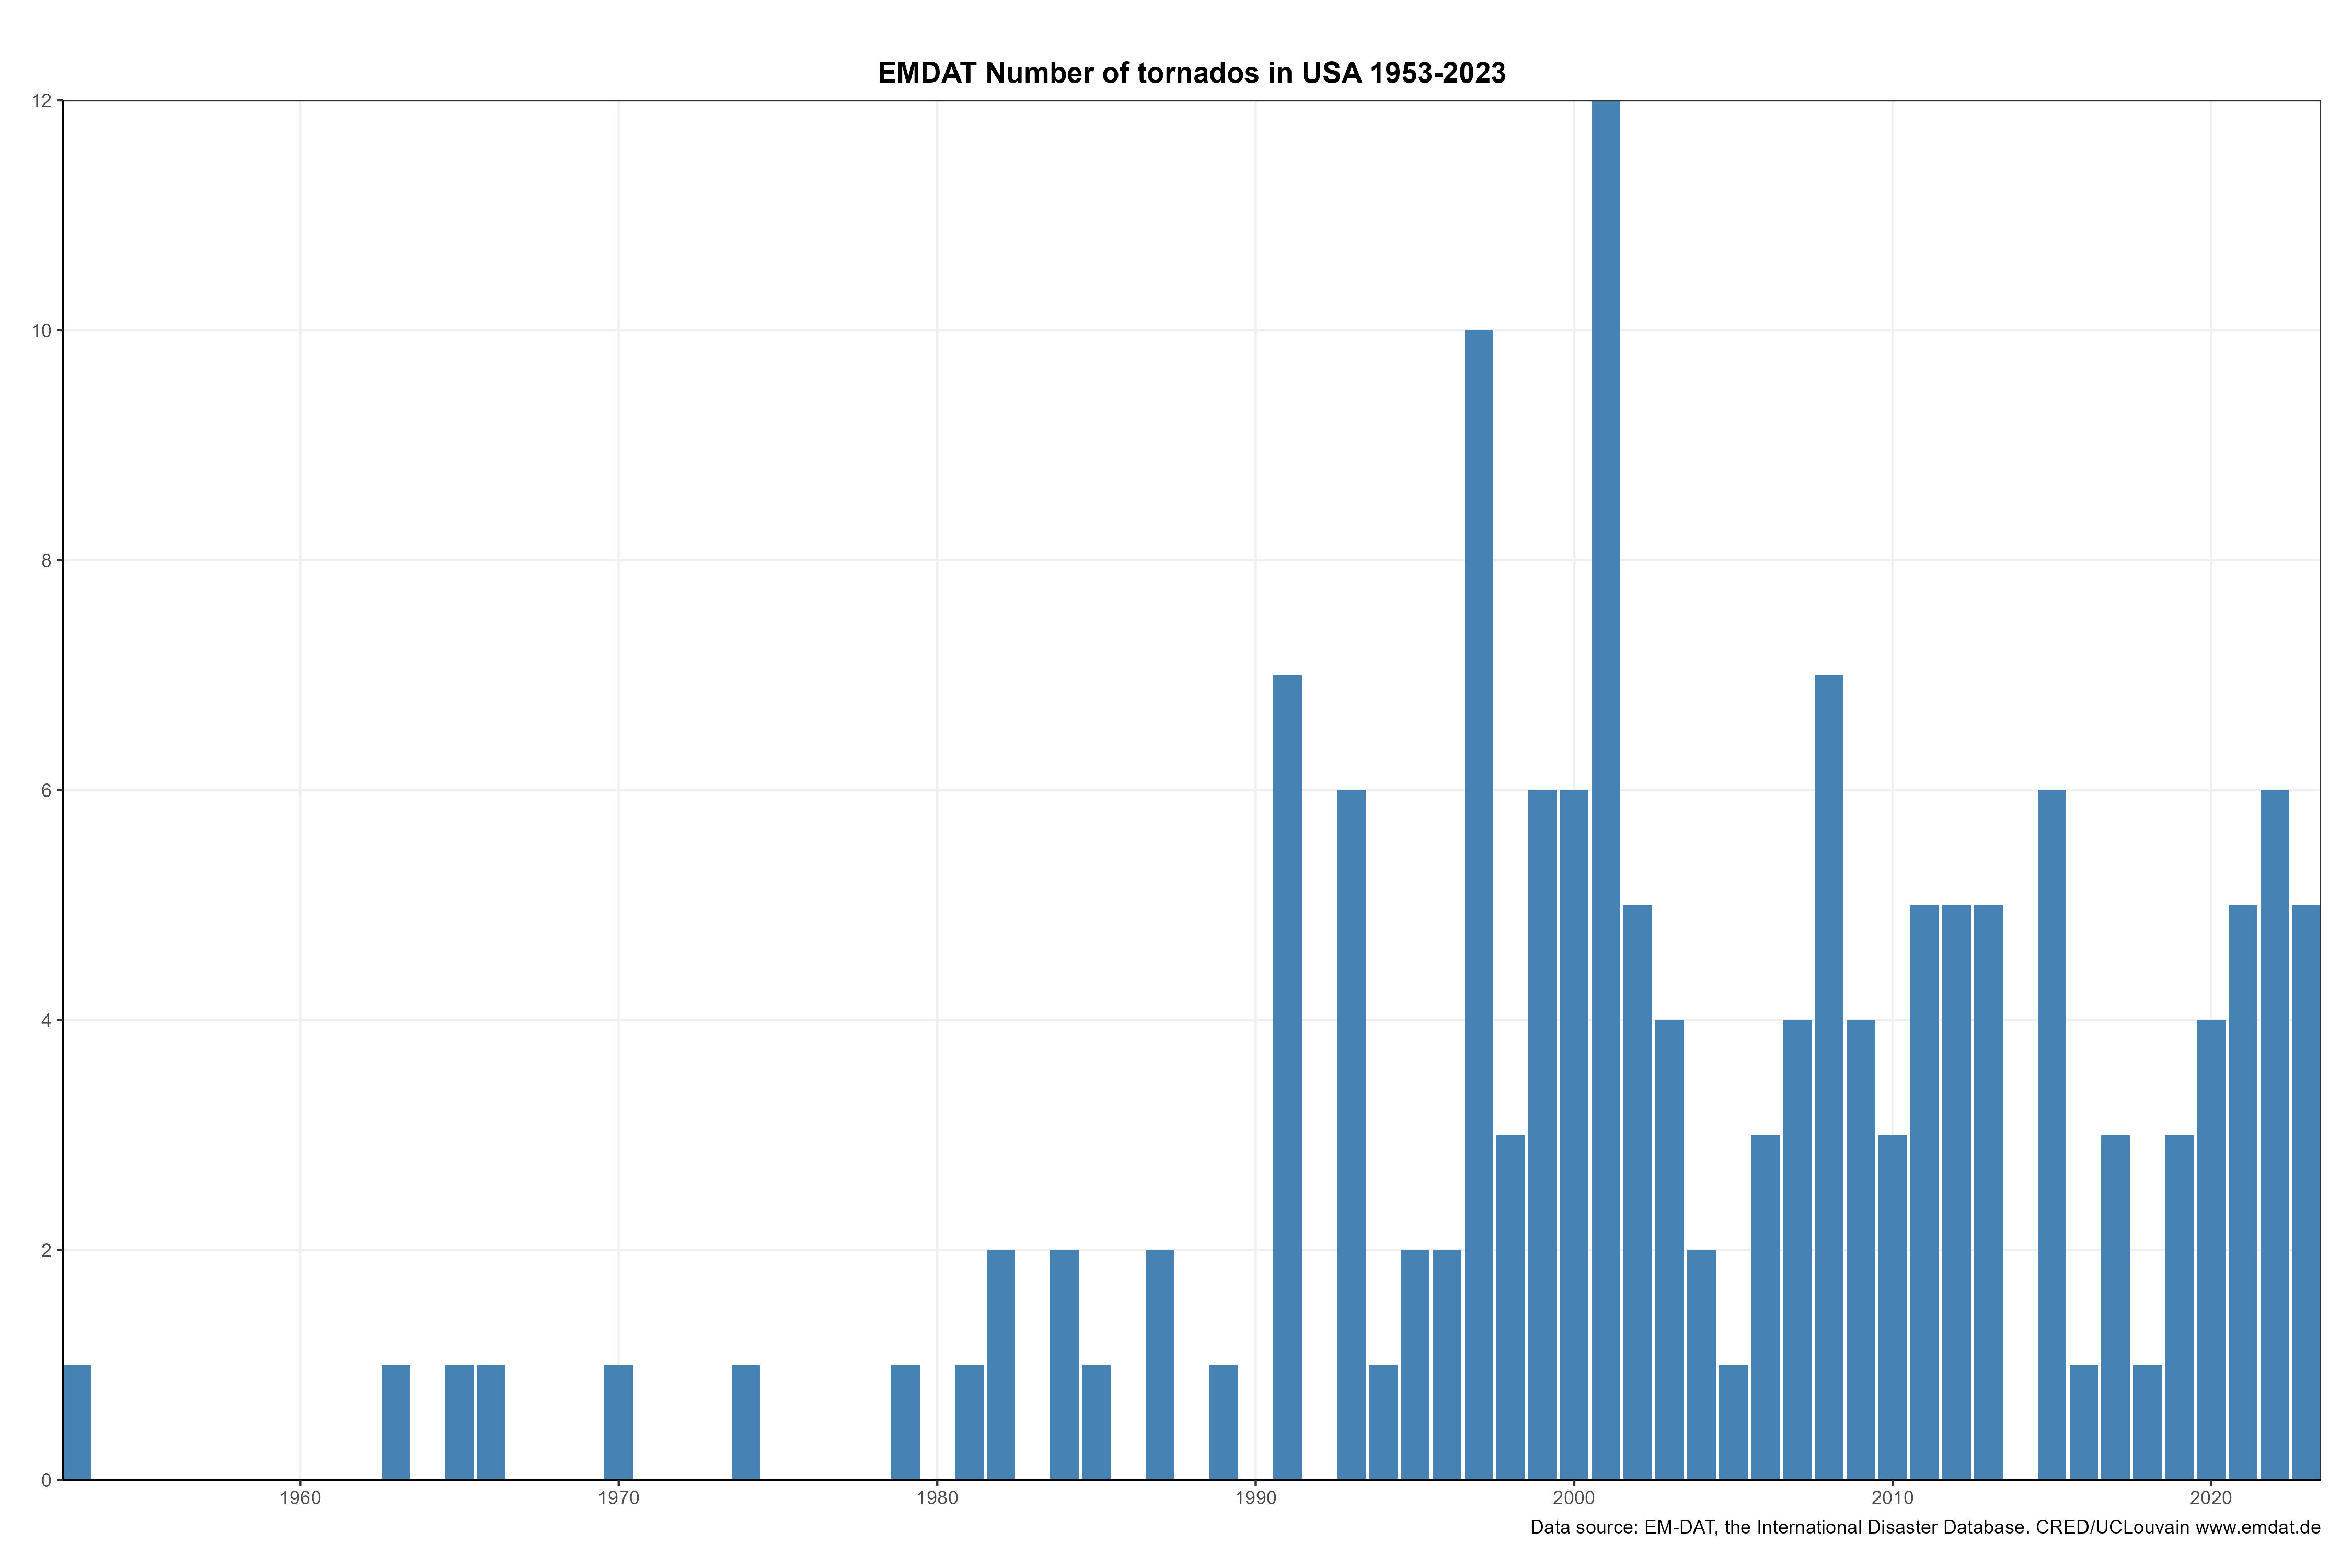
Figure: Number of tornadoes in USA for each year between 1953-2023
It seems that while tornadoes have been the issue in the USA all the time, only after end of 1980s there has been some level of data collection of tornadoes to the EM-DAT database. We also have tornado data available from NOAA. The following graph includes only the most violent tornadoes (class F3+):

While count of tornadoes might not have anything to do with the disasters caused by tornadoes since many tornadoes happen on unpopulated area causing limited or no damage, they should at least on some level match when comparing trends. It’s easy to see that the tornado trend in these datasets goes to opposite direction. EM-DAT tornado data has simply nothing to do with reality.
Also no wildfires are present in 1980 data for USA. More in-depth study would reveal some more wildfires, but at least Panorama Fire (1980) is missing from the database. In this fire 28,800 acres burned, destroying 310 homes and 67 structures, killing four people, and injuring 77 in north San Bernardino. Clearly an incident, which should be in database according to the entry criteria.
In USA it seems that only from 1990s forward the database has some level of credibility. Earlier data is simply too lacking to draw any meaningful conclusions about the increase or decrease of natural disasters. But even for recent data, you should not make any conclusions about the number of natural disasters in USA.
The same issue of underreporting on early years seems to affect almost every country I look into. The country I live in, Finland, has only three natural disasters in total in the database; two storms (1990) and one flood (2005). Living in Finland I can assure all readers that we have floods every year (especially with rivers in north we have flooding after every winter) causing material damage almost every year. We also have storms affecting tens of thousands every year usually causing material damage in the forests and lot of damages to the electricity distribution.
What is exactly the entry criteria for EM-DAT database:
Entry criteria: The reason for recording the disaster event into EM-DAT. At least one of the following criteria must be fulfilled in order for an event to be entered into the database:
- Deaths: 10 or more people deaths
- Affected: 100 or more people affected/injured/homeless.
- Declaration/international appeal: Declaration by the country of a state of emergency and/or an appeal for international assistance
As you can see the entry criteria quite relaxed: With this criteria almost every F3 or higher tornado, for example, should be in database assuming it happened on populated area.
Thus, we can conclude that the database really does not have any credibility even today, but even less during 1980s and 1990s. I don’t know how the data collection has been organized, but for scientific analysis of natural disaster trends the EM-DAT database has no scientific value. Therefore also the conclusions in the UN report have not merit. All claims that UN made about the increase of natural disasters should be retracted.
Total damages
UN also reported the sizable increase of damages. Pielke Jr has a lot more scientific merits to say anything about the normalized damages (2) during the years, but we can still make some interesting observations about the EM-DAT data for damages:
It seems that only small part of the entries has any damage data in the database. In 1994, for example, a tropical storm hit Osaka in Japan. According to the database 1000 died and 6.5 million was affected. The cost of this event is missing. This is just one of the thousands of missing damage entries. Only about 1/3 of all entries in the database has any kind of damage estimate. How do you draw any conclusions from that?
Affected people
UN claims that during 1980-1999 natural disasters affected 3.25 billion people whereas during 2000-2019 4.2 billion people was affected. But they omit to discuss the population increases. The world population was:
- 1980: 4.46 billion
- 2000: 6.14 billion
- 2019: 7.71 billion
We can make the rough estimation that during 1980-1999 the average population was 5.4 billion and during 2000-2019 the average population was 6.9 billion. More population should mean more people affected (and dead) due to natural disasters. 3.25 x (6.9/5.4) = 4.15 billion – thus the increase of people affected can be explained entirely with the world population increase. Actually even more, since most of the population increases tend to happen on natural disaster-prone areas such as India, Bangladesh and Africa.
But regarding EM-DAT dataset itself, almost 30% of the whole dataset is missing the affected people data. Older the data is, more of it is missing.
All disaster types
Earlier we concentrated to weather-related disasters. But EMDAT includes also biological, technological and geophysical disasters – all of which have nothing to do with weather or climate. Can we see the same kind increase also with other disaster types?

Simple answer: Yes. Transport-related disasters in particular have been increasing considerably based on EMDAT database. Of course some of this increase is real: all countries – not just western industrialized countries are being more dependent on technology. And this – together with population increase – also increases the number of technological disasters. But still: the same improvement in reporting as with weather-related disasters can be easily seen from this graph.
EM-DAT documentation & disclaimers
CRED
Maintainer of EM-DAT – CRED – is well aware of the issues with missing data and completeness of data overall. This has been documented on “Known Issues and Limitations” section at EM-DAT web site:
Data quality issues within EM-DAT are related to the data collection protocols from dedicated sources. EM-DAT’s completeness reflects the coverage of its sources. Since source reporting has improved over the years, EM-DAT data coverage has improved significantly over the last 30 to 40 years. Nevertheless, gaps and quality issues remain. EM-DAT protocols are meant to guide the way information is monitored and collected from sources.
EM-DAT documentation, http://www.emdata.be
The document (3) released 2004 provides interesting insights of EM-DAT data sources during the years and will explain quite well what we saw above: Why the increase of observations and reporting will explain the “increase” of natural disasters.
This diagram is from the document released by EM-DAT maintainers:

Figure: Reporting sources for EM-DAT database between 1974-2002
Natural disaster reports are provided by a number of sources and there seem to be significant evolution of EM-DAT reporting scheme during the years. Significant “increase” of natural disasters by around 1999 seems to be explained entirely by a new source of data “specialized agencies”. Specialized agencies refer to sources like UN World Food Programme, the World Health Organization or the US National Oceanic and Atmospheric Administration.
It is also good to notice how small source the “Governments” actually is. Majority of data comes from either UN organizations or from insurance companies. This itself explains the data (un)availability from former Soviet Union, Pre-1990s China and Eastern Block countries – No UN organization nor global insurance companies had any meaningful presence on those countries. Insurance companies are interested on insured wealth only. And that has been tremendous increase of insured wealth during the decades.
This “Time Bias” issues have also been documented by CRED as follows:
Technologies and initiatives can be considered responsible for the dominant trend observed. Therefore, it is challenging to infer insight into the actual drivers of disasters such as climate change, population growth, or disaster risk management. Accordingly, excluding pre-2000 data from trend analyses based on EM-DAT is strongly recommended. From September 2023 onward, the CRED refers to pre-2000 data as historic data in the EM-DAT Public Table.
EM-DAT documentation, Time Bias
Now there is clear disclaimer at the EM-DAT download page. You have to acknowledge the fact that “historic” data has biases and there are issues with data before you can download it.
WMO
Even WMO recognizes the issues in EM-DAT data. Disclaimer about data issues is available in the WMO report itself if you look close enough:
Disasters and impacts by decade
WMO Atlas of Mortality and Economic Losses from Weather, Climate and Water Extremes (1970–2019), page 28
There was an increase in the number of recorded disasters attributed to weather, climate and water hazards over the period: disasters were reported more frequently by decade, up from one disaster on average every fifteen day to one every three days over the 50 years. One hundred and four disasters were recorded per year on average over the last two decades. This increase may be a result of reporting bias whereby disasters are have
been recorded more frequently since the year 2000 than during previous decades due to advances in technology and the international focus on disaster risk reduction
So they know the issues with EM-DAT quality for historic data, but this does not prevent them from using the claim in press releases while making it easy for various newspapers to quote the five-fold increase of weather-related disasters as a fact. There seem to be intensive at WMO to promote increase of weather-related disasters even if it is based on flawed data.
Studies regarding EM-DAT database
EM-DAT database has been subject to several studies covering areas such as data quality issues, missing data and completeness of collected data. Please refer to references section for more information.
Summary
- EM-DAT data collection methods have significantly evolved during the years rendering trend analysis totally invalid
- Evolution of historic data coverage can be easily seen when comparing EM-DAT data to other sources and by analyzing missing data
- Issues with historic (pre-2000) EM-DAT data are well known to both EM-DAT maintainer (CRED) and WMO and well documented
- All claims about five-fold increase of natural disasters are thus invalid and based on flawed data
REFERENCES
- EM-DAT, CRED / UCLouvain, Brussels, Belgium – www.emdat.be (D. Guha-Sapir)
- Pielke, R. (2020). Economic ‘normalisation’ of disaster losses 1998–2020: a literature review and assessment. Environmental Hazards, 1-19.
- D. Guha-Sapir D. Hargitt P. Hoyois, Thirty years of natural disasters 1974-2003: the numbers, centre for Research on the Epidemiology https://www.unisdr.org/files/1078_8761.pdf
- WMO Atlas of Mortality and Economic Losses from Weather, Climate and Water Extremes (1970 – 2019)
- Jones, R. L., Guha-Sapir, D., and Tubeuf, S.: “Human and economic impacts of natural disasters: can we trust the global data?”, Sci Data, 9, 572 (2022). https://doi.org/10.1038/s41597-022-01667-x.
- Guha-Sapir, D. and Misson, C.: “The Development of a Database on Disasters.”, Disasters, 16, 74–80 (1992), https://doi.org/10.1111/j.1467-7717.1992.tb00378.x.
- R code to generate all graphs in this post
