
26 of October 2022 by Pasi Autio

High-profile science magazine just released 2022 Lancetcountdown report, which – according to Lancet – “tracks the relationship between health and climate change across five key domains and 43 indicators”. According to report, the report will reveal that “the world is at a critical juncture”.
Unfortunately, the report reveals also some really bad and incorrectly reported science. Let us walk through some of these “Indicators” discussing what they really contain.
Indicator 1.1.2: exposure of vulnerable populations to heatwaves—headline finding: in 2012–2021, children younger than 1 year experienced 600 million more persondays of heatwaves, and adults older than 65 years experienced 3·1 billion more than in 1986–2005.
Lancet is claiming significant increase of “heatwave exposure” for people older than 65 years. However, this claim makes sense only if you also take in account how the population of people older than 65 has changed during the years.
According to World bank data the size increase of this age group has been significant. During the years 1986-2005 this population group size was – in average – 379 million people whereas during 2012-2021 the size was – in average – 642 million with the increase being 263 million. Thus, during 10 years the additional 263 million people needs to experience just 1.2 heatwave days per year to get 3.1 billion persondays of additional heatwave exposure the report claimed.
Science behind this indicator comes from the study Chambers 2020, which indeed discusses about absolute exposure to heatwave days – also relative, but clearly this is not as interesting for the Lancet report. While the indicator does not say that it is mostly essentially just an indicator of people getting older, it gives the impression to indicate something more – namely climate change – is behind this increase. The report could have said this clearly, but Lancet authors chose not to.
The same increase applies also to the children younger than 1 years: The age group is now much bigger.
Indicator 1.1.5: heat-related mortality—headline finding: heatrelated mortality for people older than 65 years increased by approximately 68% between 2000–04 and 2017–21.
This indicator is basically a variation of indicator 1.1.2, but just discussing about mortality instead of exposure and time period is a little different. Once again: The age group 65+ size has increased by 58% between these periods according to World Bank data. Thus, most of the “increase” can be attributed just to the population group increase. But what has increased even more is the size of the age group of 80+ years and those are the people who really are vulnerable to heat.
Source of this data? This is funny: It’s Lancetcountdown 2021 report. After this 2021 report was released, I contacted about this exact same “Indicator” to Lancet scientist Marina Romanello. In an e-mail discussion she admitted that this indicator really discusses about absolute increase in heat-related mortality and even that was modelled based on one study covering one country only – not calculated from the real records. Soon after the discussion this indicator was removed from the Lancet site – or actually replaced with something else. Now it’s back.
The other reference is an other flawed study I already discussed about earlier.
Indicator 1.4: food security and undernutrition— headline finding: compared with 1981–2010, increased temperatures in 2021 shortened crop growth seasons globally by 9·3 days for maize, 1·7 days for rice, and 6·0 days for winter and spring wheat, and heatwave days were associated with 98 million more people reporting moderate to severe food insecurity in 2020.
This indicators gives you impression that crop production is going down. However, according to FAO total production of primary crops increased by 53 percent between 2000 and 2019, to a record high of 9.4 billion tonnes in 2019. During the season 2021/2022 the world cereal production was highest ever – even higher than on 2019.
So yes, if you want to give an impression of a problem, it’s easy to that just by omitting the key fact.
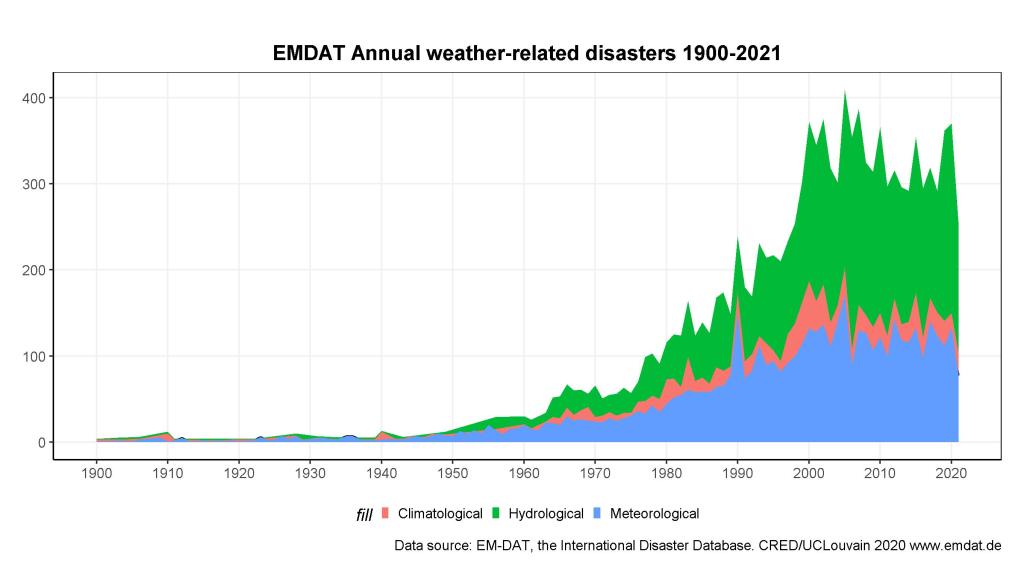
Indicator 2.3.2: lethality of extreme weather events—headline finding: the average lethality per climate-related disaster has decreased from 837 deaths in 1980–89 to 46 in 2012–21, and is negatively associated with health-care spending. The number of reported climate and weather-related disasters has increased five-fold in the past 50 years.
Here we go again: five-fold increase of climate and weather-related disasters in 50 years. This is something I have already discussed earlier. The claim is based on serially misused EMDAT database. Yes, there is five-fold increase of reported disasters – emphasis on “reported”. That’s what it is: if you collect more data, you can report more events based on that data. Please read the previous blog text regarding EMDAT problems if you want all the details about this topic.
Summary
While I did not walk through all of the indicators, I think this is already enough the show how biased this Countdown report is.
And guess what, there is already at least one media channel reporting about these indicators: Guardian, known for “in-depth” climate reporting took the bait and now tells us:
It [Lancetcountdown report] found that heat-related deaths in the most vulnerable populations – babies under a year old and adults over 65 – increased by 68% over the past four years compared with 2000-04.
Guardian October 25th 2022
There it is. Absolute increase of heat-based deaths from indicator 1.1.5 reported as it would be relative increase. They don’t actually lie, but chose not to inform us about the key fact: This is (modelled) absolute increase, not relative. This is just the type of reporting Lancet wanted by writing the Indicator in way they did.
You are the judge: Did we get world-class science reporting from high-profile Lancet magazine?
References:
